Key Findings
Homelessness appears to have stabilized in early 2025, marking a potential turning point after years of sharp increases. Across 170 communities that have released preliminary 2025 Point-in-Time counts, total homelessness decreased by about 2 percent compared to 2024. Unsheltered homelessness fell by about 3 percent and sheltered homelessness by about 2 percent. After back-to-back annual increases of approximately 15 percent (2022 to 2023) and 19 percent (2023 to 2024) in these same reporting communities, based on matched HUD PIT data, the shift from rapid growth to a roughly flat trajectory is notable. While homelessness remains near record levels, the projected 2025 national total is approximately 755,000, down from the record 771,480 counted in 2024.
Veteran homelessness continued its long-term decline. Among 177 communities reporting veteran-specific data, veteran homelessness fell an estimated 3.2 percent. If the national rate of change is similar to the reporting sample, the projected 2025 national total is approximately 31,800, down from the official 2024 count of 32,882. If confirmed, this would be the lowest number ever recorded, extending a decline of more than 55 percent since 2010.
These findings come with important caveats. The communities reporting so far tend to be larger and more urban than those that have not yet reported. Among the communities in this sample, the decline is concentrated in major cities; rural and suburban communities actually show small increases. The findings should be treated as directional indicators until HUD releases official national data.
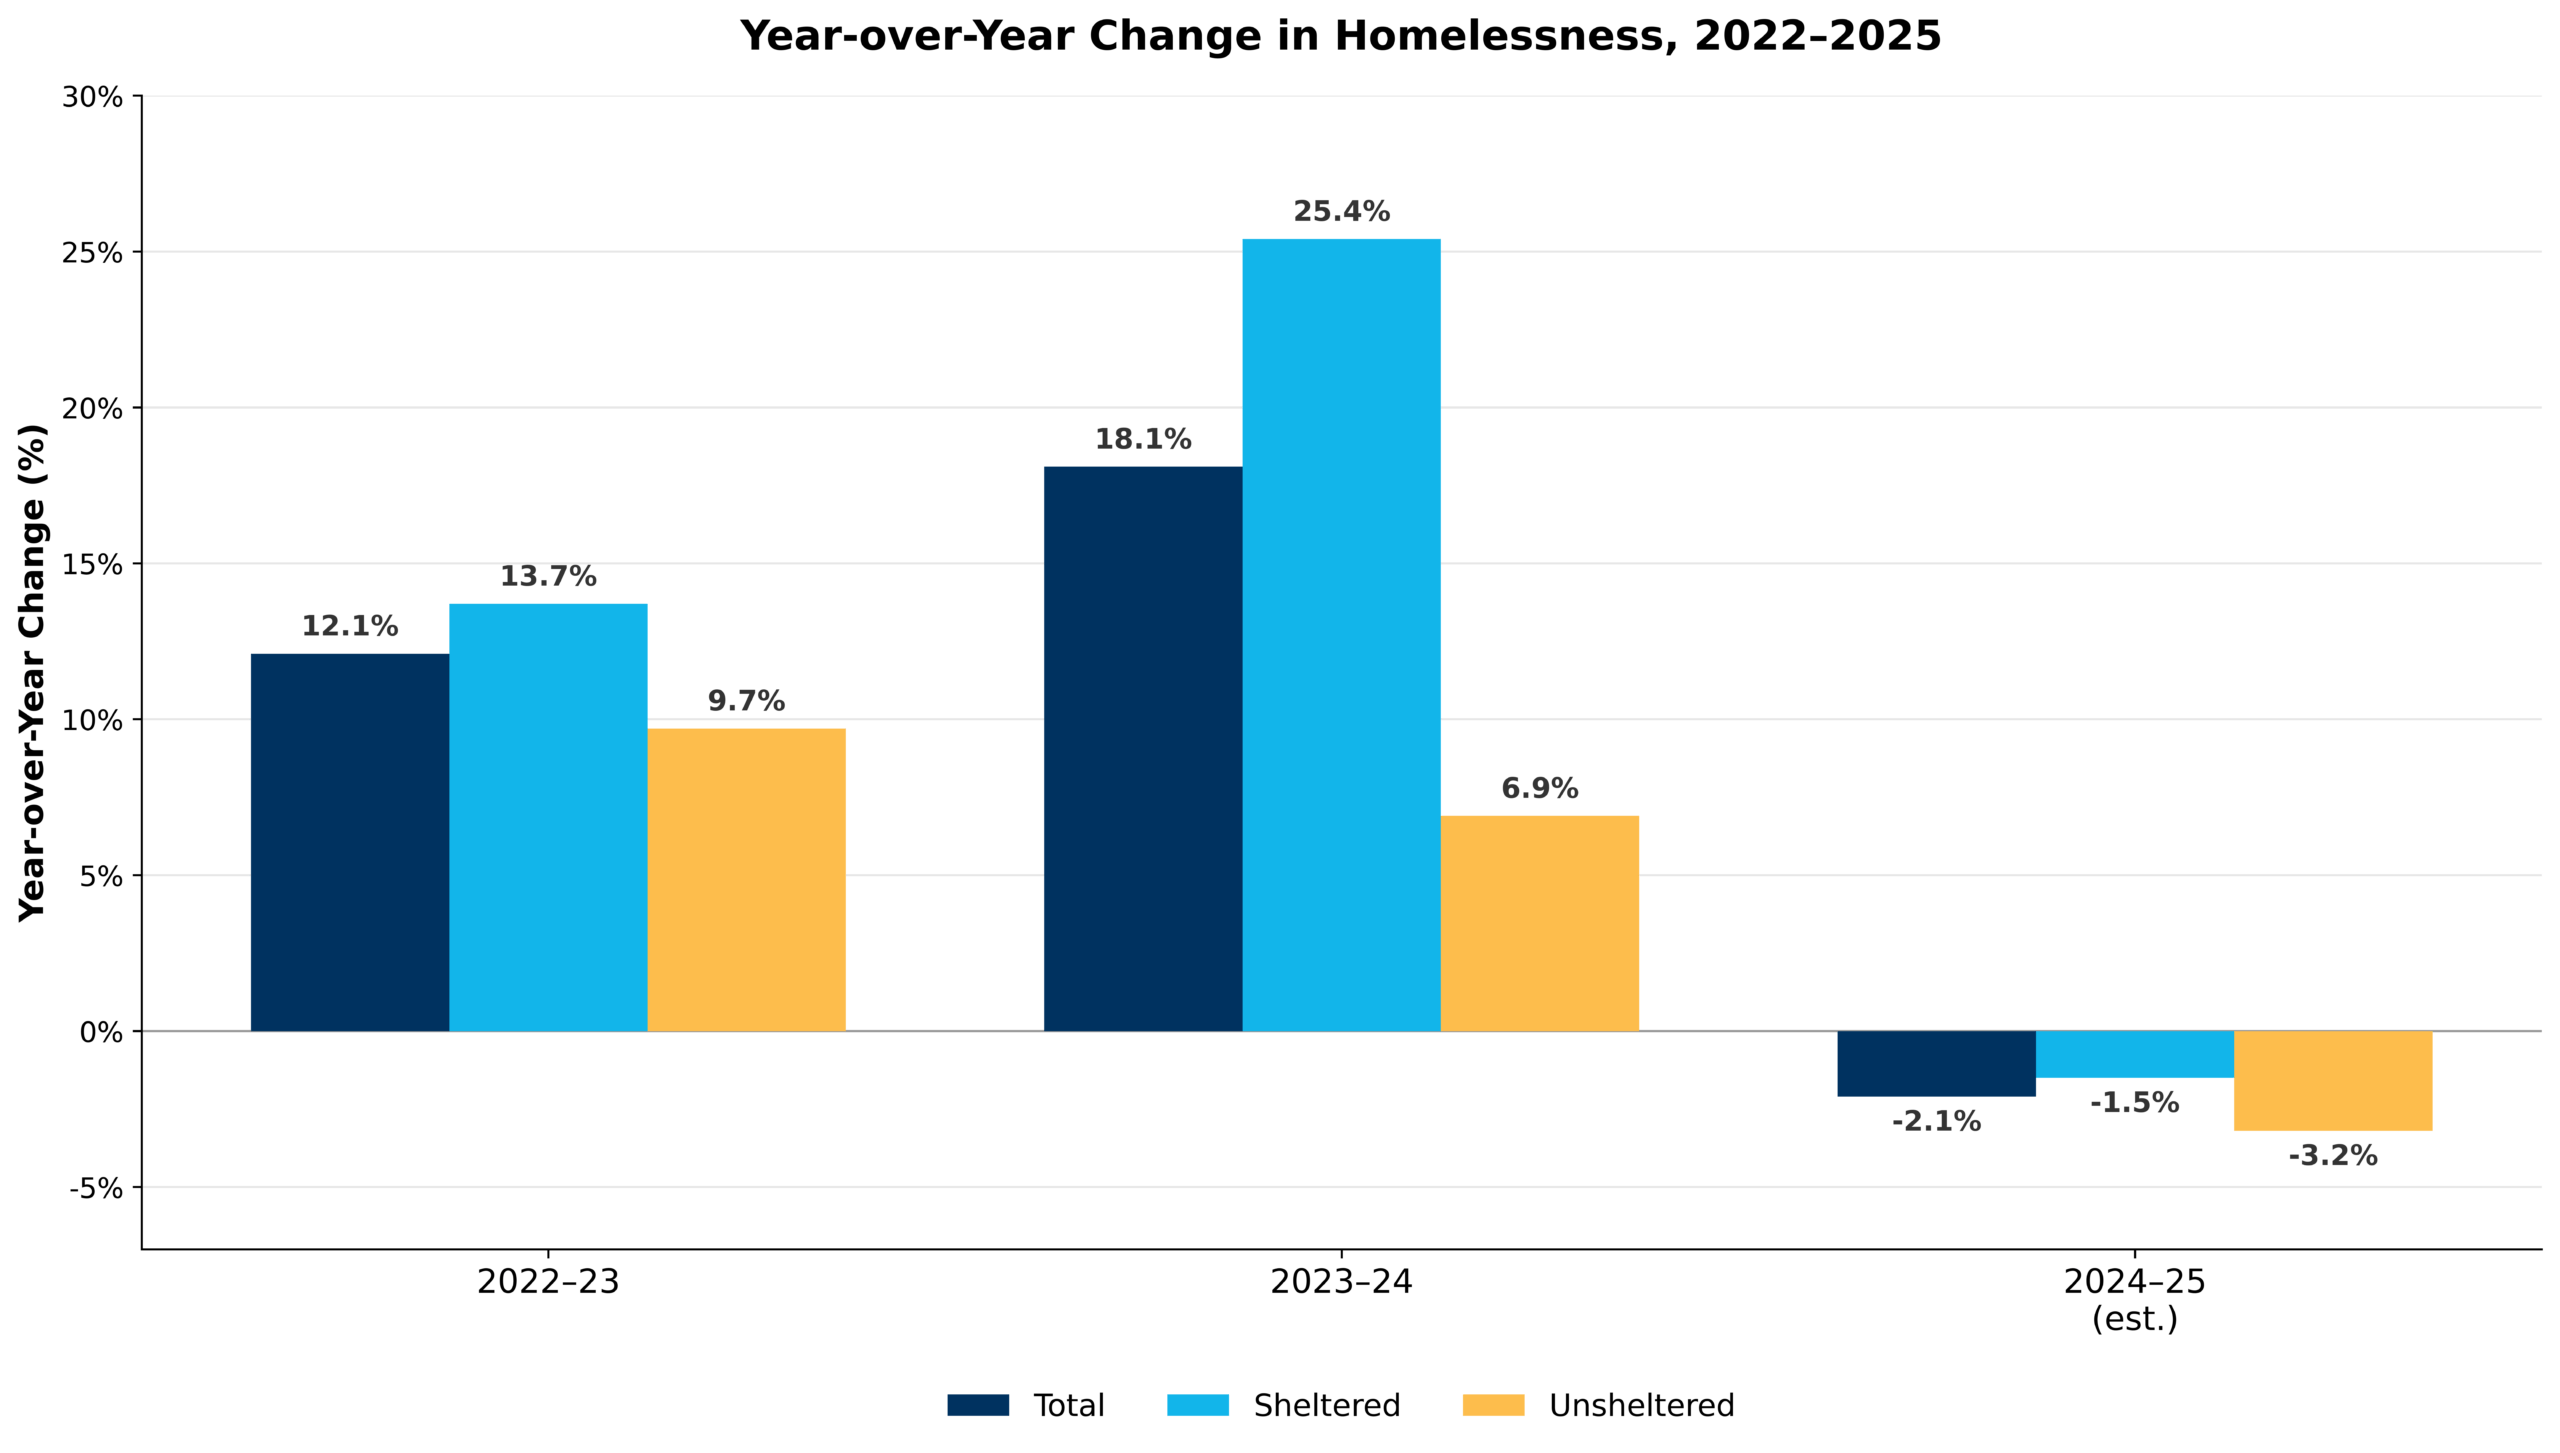
Exhibit 1: Estimated Change in Homelessness, 2024 to 2025
| Population | 2024 Count | 2025 Estimate | Estimated Change |
|---|---|---|---|
| Total Homelessness | 771,480 | ~755,300 | -2.1% |
| Sheltered Homelessness | 497,256 | ~489,600 | -1.5% |
| Unsheltered Homelessness | 274,224 | ~265,500 | -3.2% |
| Veteran Homelessness | 32,882 | ~31,800 | -3.2% |
Introduction
Each January, communities across the United States conduct the Point-in-Time count, a federally mandated census of people experiencing homelessness in shelters and in unsheltered settings. PIT data have historically served as a primary benchmark for federal funding decisions, policy development, and public understanding of the scale of homelessness locally and nationwide.
After several years of substantial national increases, the 2025 PIT results provide an important early indication of whether those trends are continuing or beginning to change. By aggregating publicly available data from 170 local Continuums of Care for overall homelessness and 177 for veteran homelessness, this report offers a snapshot of emerging national patterns ahead of the release of official federal statistics.
As of March 2026, the U.S. Department of Housing and Urban Development (HUD) has not yet released the 2025 Annual Homelessness Assessment Report (AHAR) Part 1. The data in this report were compiled by Community Solutions from publicly available CoC reports, press releases, and community websites. Because these data have not undergone HUD’s quality assurance process, all findings should be treated as preliminary directional indicators.
Methodology
This analysis includes communities where preliminary 2025 Point-in-Time results were identified through official local government releases, media reporting, or other publicly available sources. The rigor of source documentation varies across communities.
Beginning in early 2025, preliminary PIT results were identified through ongoing monitoring of municipal and Continuum of Care websites and news sources, supported by automated alerts, and compiled into a centralized tracking database to ensure consistency and accuracy.
The analysis compares preliminary 2025 PIT counts to 2024 results within the same group of communities. National estimates are produced using a population-weighted ratio estimator, which applies the rate of change observed in reporting communities to the known 2024 national total. Findings are presented as directional indicators rather than causal or predictive estimates. Detailed statistical methods are described in Appendix B.
Scope and Representation
The overall dataset includes 170 of the 385 Continuums of Care nationwide. While this represents approximately 44 percent of all jurisdictions, these communities account for nearly 69 percent of individuals counted in the 2024 PIT. The veteran sample is slightly larger because seven communities released veteran-specific PIT data, often through VA or Continuum of Care veteran reporting channels, without having publicly released their overall PIT count totals at the time of data collection.
Because reporting communities are not a random sample of all CoCs, larger and more urban communities are over-represented. Appendix A provides a detailed representativeness analysis.
In a small number of cases, reported values were constructed or estimated from available data. For example, some communities reported only sheltered or unsheltered veteran counts, and totals were derived accordingly. A small number of communities reported approximate values. These cases are noted in the accompanying datasets.
Overall Homelessness
Total Homelessness Trends
Across the reporting sample, total homelessness declined by 2.1 percent compared to 2024. While modest in size, this change represents a meaningful departure from recent patterns. In the prior two years, these same communities experienced large year-over-year increases, with total homelessness rising by approximately 15 percent between 2022 and 2023 and by an additional 19 percent between 2023 and 2024, based on matched HUD PIT data for the same group of communities.
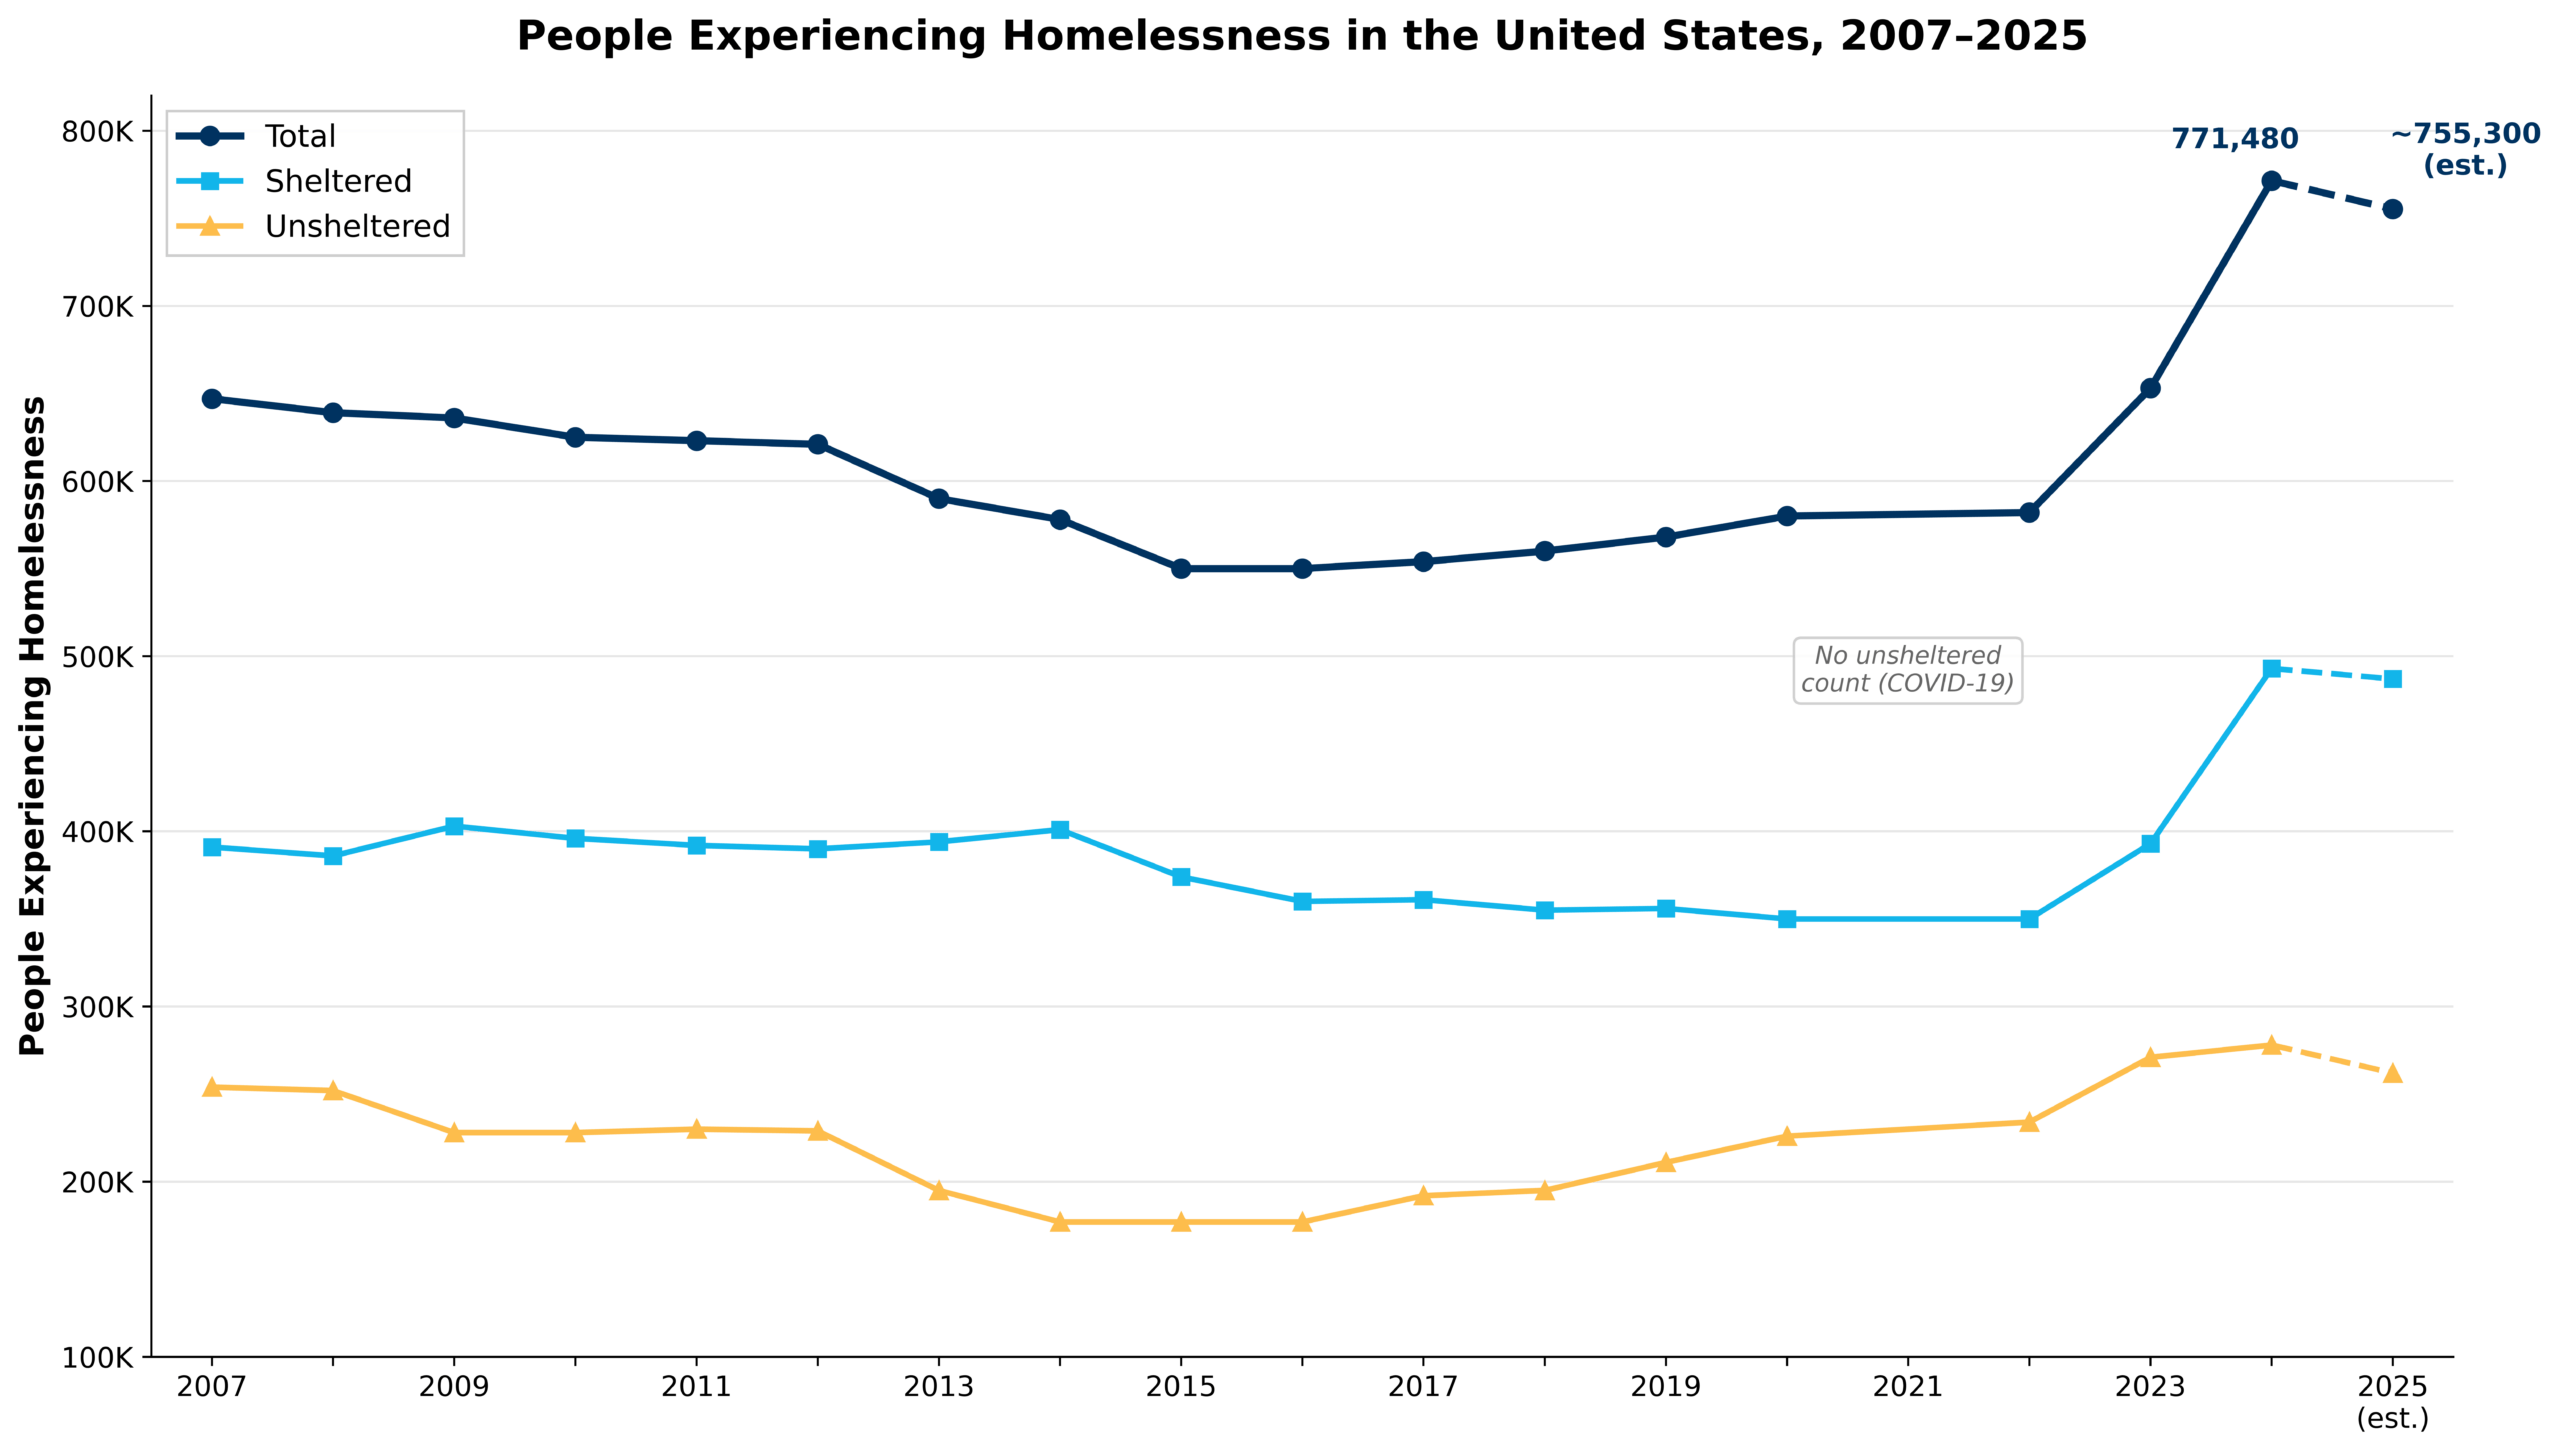
The shift from sustained increases to a small net decline suggests that the rapid expansion of homelessness seen in recent years has slowed. At a national level, this pattern is consistent with a period of stabilization, in which the number of people entering homelessness is more closely balanced with the number exiting. If the trends in reporting communities are indicative of the nation as a whole, the estimated 2025 national total would be approximately 755,300, down from the record 771,480 counted in 2024.
Unsheltered Homelessness Trends
A similar pattern is observed among people experiencing unsheltered homelessness, defined as individuals living in places not meant for human habitation, such as vehicles, encampments, or parks. Across the reporting sample, unsheltered homelessness declined by approximately 3 percent compared to 2024. While this change is not uniform across communities, it stands in contrast to recent trends, when unsheltered homelessness increased by approximately 11 percent between 2022 and 2023 and by an additional 5 percent between 2023 and 2024, further supporting the conclusion that growth has slowed.
Historical Context
Exhibit 2: People Experiencing Homelessness in the United States, 2007 to 2025
Variation by Community Type
The national trend masks significant variation across different types of communities. Major City CoCs show the strongest decline at approximately 4 percent. Rural and suburban communities, by contrast, show small increases of about 3 percent and 1 percent, respectively.
Among the 170 reporting communities, 93 (55 percent) experienced an increase in total homelessness while 77 (45 percent) experienced a decrease. The aggregate decline reflects the outsized weight of a handful of large, decreasing communities.
Exhibit 3: Estimated Change in Total Homelessness by Community Type
| Community Type | Reporting / Total | Estimated Change | Direction |
|---|---|---|---|
| Largely Rural | 34 / 111 | +3.2% | Small increase |
| Largely Suburban | 76 / 165 | +1.0% | Essentially flat |
| Major City | 36 / 48 | -4.0% | Decline |
| Other Largely Urban | 24 / 61 | -0.5% | Essentially flat |
Veteran Homelessness
Continued Decline
Veteran homelessness has been declining for more than a decade. The preliminary 2025 data suggest that the trend is continuing. Across 177 reporting communities covering approximately 64 percent of the 2024 veteran population, the aggregate veteran count fell from 21,005 to 20,324, a decline of about 3 percent.
Projected nationally using the official 2024 baseline of 32,882, the estimated 2025 total is approximately 31,800. If confirmed, this would be the lowest number ever recorded.
Exhibit 4: Veterans Experiencing Homelessness, 2010 to 2025
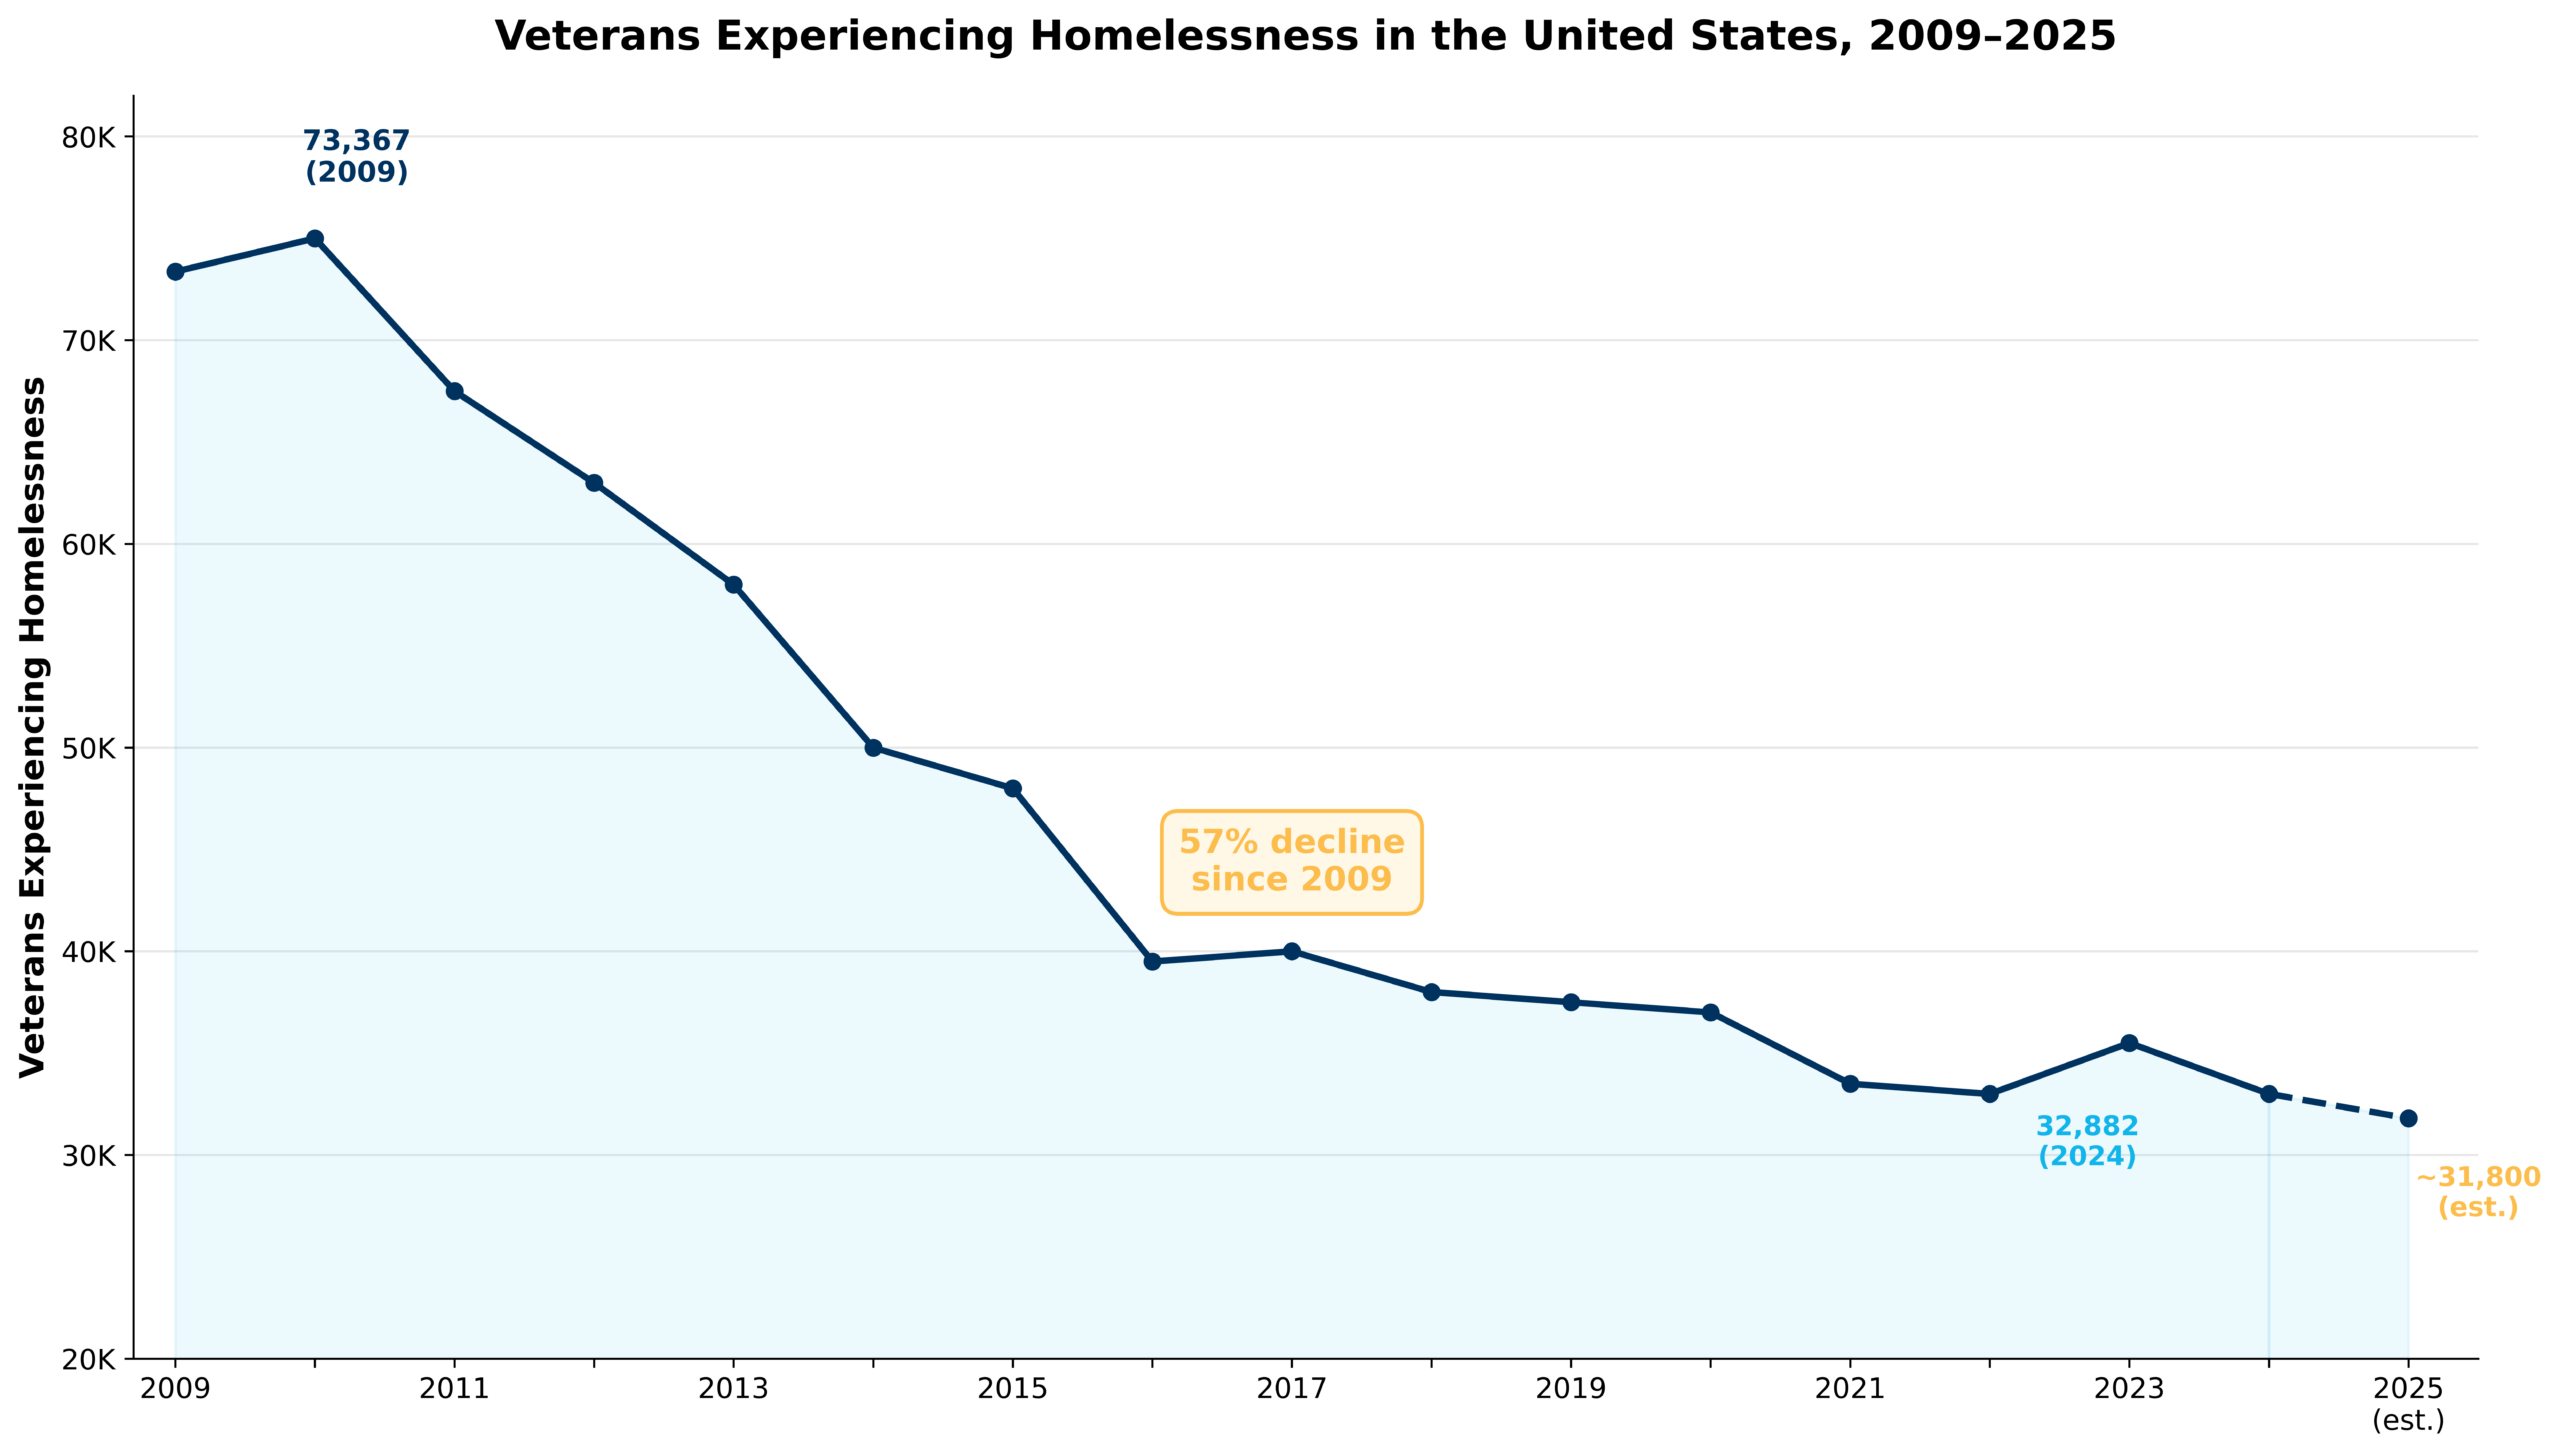
The more than 55 percent decline since 2010 reflects the cumulative impact of targeted federal investments, including HUD-VASH, SSVF, and GPD, combined with sustained local collaboration among nonprofit organizations, public agencies, and Continuums of Care working together to identify, engage, and house veterans. According to HUD data, veterans remain the only major population to show a sustained, multi-year reduction in homelessness.
Variation by Community Type
All four community types show estimated declines in veteran homelessness, though the magnitude varies. Largely Suburban communities show the strongest decline at approximately 7 percent. Major City communities show an estimated decline of less than 1 percent, and rural and other urban communities fall in between.
Exhibit 5: Estimated Change in Veteran Homelessness by Community Type
| Community Type | Reporting / Total | Estimated Change | Direction |
|---|---|---|---|
| Largely Rural | 36 /111 | -3.3% | Decline |
| Largely Suburban | 85 / 165 | -6.8% | Decline |
| Major City | 30 / 48 | -0.7% | Essentially flat |
| Other Largely Urban | 26 / 61 | -7.6% | Decline |
Limitations
While the preliminary findings suggest a stabilization in homelessness, several limitations inherent to the Point-in-Time count methodology should be considered when interpreting these results.
- The 2025 figures included in this analysis have not yet been confirmed as having undergone final cleaning, on a local CoC level, nor publicly validated by HUD. Local jurisdictions may revise counts after federal submission.
- Although the communities included in this analysis accounted for approximately 69 percent of individuals counted in the 2024 PIT, trends in jurisdictions not included may differ from those observed in this sample. Larger and more urban communities are over-represented.
- Several large jurisdictions had not publicly released full 2025 PIT results at the time of analysis, including Metropolitan Denver, Massachusetts Balance of State, Alameda County, San Francisco, Las Vegas/Clark County, Orange County, Hawaii Balance of State, Georgia Balance of State, Sacramento, and San Joaquin County.
- The overall decline is concentrated in major cities, while rural and suburban communities show small increases. National projections assume that trends in unreported communities are similar to those in reported communities, an assumption that cannot be verified until HUD releases official data.
Conclusion
Analysis of preliminary data from 170 Continuums of Care suggests that homelessness levels in the United States began to level off as of January 2025. The estimated 2.1 percent decline in total homelessness represents a meaningful change following record year-over-year increases between 2022 and 2024. While homelessness remains at high levels and these findings are preliminary, the data indicate that the period of rapid growth in homelessness may have reached an inflection point.
Veteran homelessness continues its long-term downward trajectory, with an estimated 3 percent decline to approximately 31,800. If confirmed, this would extend a decline of more than 55 percent since 2010. The growing adoption of real-time data systems across communities continues to strengthen the ability to monitor and respond to veteran homelessness as it occurs.
Official 2025 data from HUD, expected later in 2026, will provide a definitive picture. For now, the central finding is straightforward: after years of accelerating crisis, the 2025 data show a national system that has begun to stabilize, and in the case of veteran homelessness, one that continues to prove the problem is solvable.
Definitions
- Point-in-Time (PIT) Count: A census conducted annually in January that estimates the number of people experiencing homelessness in shelters and in unsheltered locations on a single night.
- Sheltered Homelessness: Individuals staying in emergency shelters, transitional housing, or safe haven programs.
- Unsheltered Homelessness: Individuals living in places not meant for human habitation, such as streets, vehicles, or encampments.
- Continuum of Care (CoC): A local or regional planning body responsible for coordinating homelessness response efforts.