Key Findings
We estimate that homelessness continued to decrease in the US during 2026, with an estimated 6 percent decrease, continuing a decline that started in 2025. If the 2026 estimate holds, it will be the largest single-year decline in homelessness since HUD began national Point-in-Time reporting in 2007, in both percentage and number of people. Homelessness is falling in most communities that have reported a 2026 count. Across the 182 communities that have publicly reported a 2026 PIT count, the total was 6.2 percent lower than a year earlier. Of the 182, 103 counted fewer people than in 2025 and 79 counted more.
Both sheltered and unsheltered homelessness declined. Sheltered counts fell 7.4 percent across the communities that measured both populations in both years, and unsheltered counts fell 4.8 percent.
If the trends in reporting communities are indicative of the nation as a whole, the 2026 count will fall to roughly 700,000. Applying the reporting communities’ rate of change to HUD’s 2025 national total gives an estimated 2026 national total of about 699,700, with an estimated range of 671,700 to 732,500. That is 6.2 percent below 2025 and 9.3 percent below the record 771,480 counted in 2024. Sheltered homelessness is estimated to fall 7.4 percent and unsheltered 4.8 percent.
Exhibit 1: Estimated change in homelessness, 2025 to 2026
| Population | 2025 Count | 2026 Estimate | Estimated Change |
|---|---|---|---|
| Total Homelessness | 745,652 | ~699,700 | -6.2% |
| Sheltered Homelessness | 479,332 | ~443,800 | -7.4% |
| Unsheltered Homelessness | 266,320 | ~253,700 | -4.8% |
Source: 2025 counts from HUD’s 2025 AHAR Part 1. 2026 estimates apply the change across the 182 reporting communities to those totals, as described in Methodology. Estimates are rounded to the nearest hundred.
Introduction
Each January, communities across the United States conduct the Point-in-Time count, a federally mandated census of people experiencing homelessness in shelters and in places not meant for human habitation (e.g., streets, cars, encampments). PIT counts have historically served as a primary benchmark for federal funding decisions, policy development, and public understanding of the scale of homelessness locally and nationwide.
Communities publicly release their own results over the spring and summer, ahead of HUD’s official national releases. For the second year in a row, Community Solutions has been tracking the public release of these counts to understand trends across our Network and the US in general. This analysis compiles the 2026 counts released publicly as of September 4, 2026, and compares them with 2025’s official PIT count release. As of that date, 182 communities had a 2026 count that could be compared with 2025. As with Community Solutions’ 2025 Homelessness Estimates, the figures here are compiled from local releases ahead of the official data and should be read as directional indicators.
Methodology
This analysis includes communities where preliminary 2026 Point-in-Time results were identified through official local government or Continuum of Care releases, media reporting, or other publicly available sources. The rigor of source documentation varies across communities. All community figures and sources have been logged in a tracking database. New York City has not published a 2026 count; its figure, 105,100, is derived from the city’s own monthly shelter census and its 2026 street count.
To estimate a national figure, this report follows our 2025 Homelessness Estimates: the rate of change across the reporting communities is applied to HUD’s 2025 national total. The 182 comparable communities account for 74 percent of the 745,652 people counted nationally in 2025.
Overall Homelessness
Total Homelessness Trends
Among the 182 communities, the combined 2026 count was 515,584 people, 6.2 percent below the 549,431 counted in 2025. The direction was consistent across most communities: 103 counted fewer people and 79 counted more. Measured against January 2024, the 181 reporting communities were 11.8 percent lower.
The decline reverses the years-long trend of recent annual increases. National Point-in-Time counts climbed by about a third between 2022 and 2024, reaching a record of roughly 770,000 people in January 2024. In 2025, the count fell to 745,652, its first decline in years. Community Solutions’ preliminary analysis of the 2025 counts, published ahead of HUD’s official figures, had estimated a decline of about 2 percent from 170 reporting communities; the official HUD figure was 3.3 percent.
The 2026 results reported so far suggest that decline continued at an even more rapid pace.
The reporting communities are not a random sample, so to develop the national estimate we apply their rate of change to the corresponding national totals, the approach we used in our 2025 analysis. That puts the estimated 2026 national total at about 699,700, with a range of roughly 671,700 to 732,500, about 6 percent below 2025 and 9 percent below the 2024 peak, with national unsheltered homelessness near 253,700 and sheltered near 443,800.
Exhibit 2: National Point-in-Time totals, sheltered and unsheltered, 2007 to 2025, with the 2026 estimate
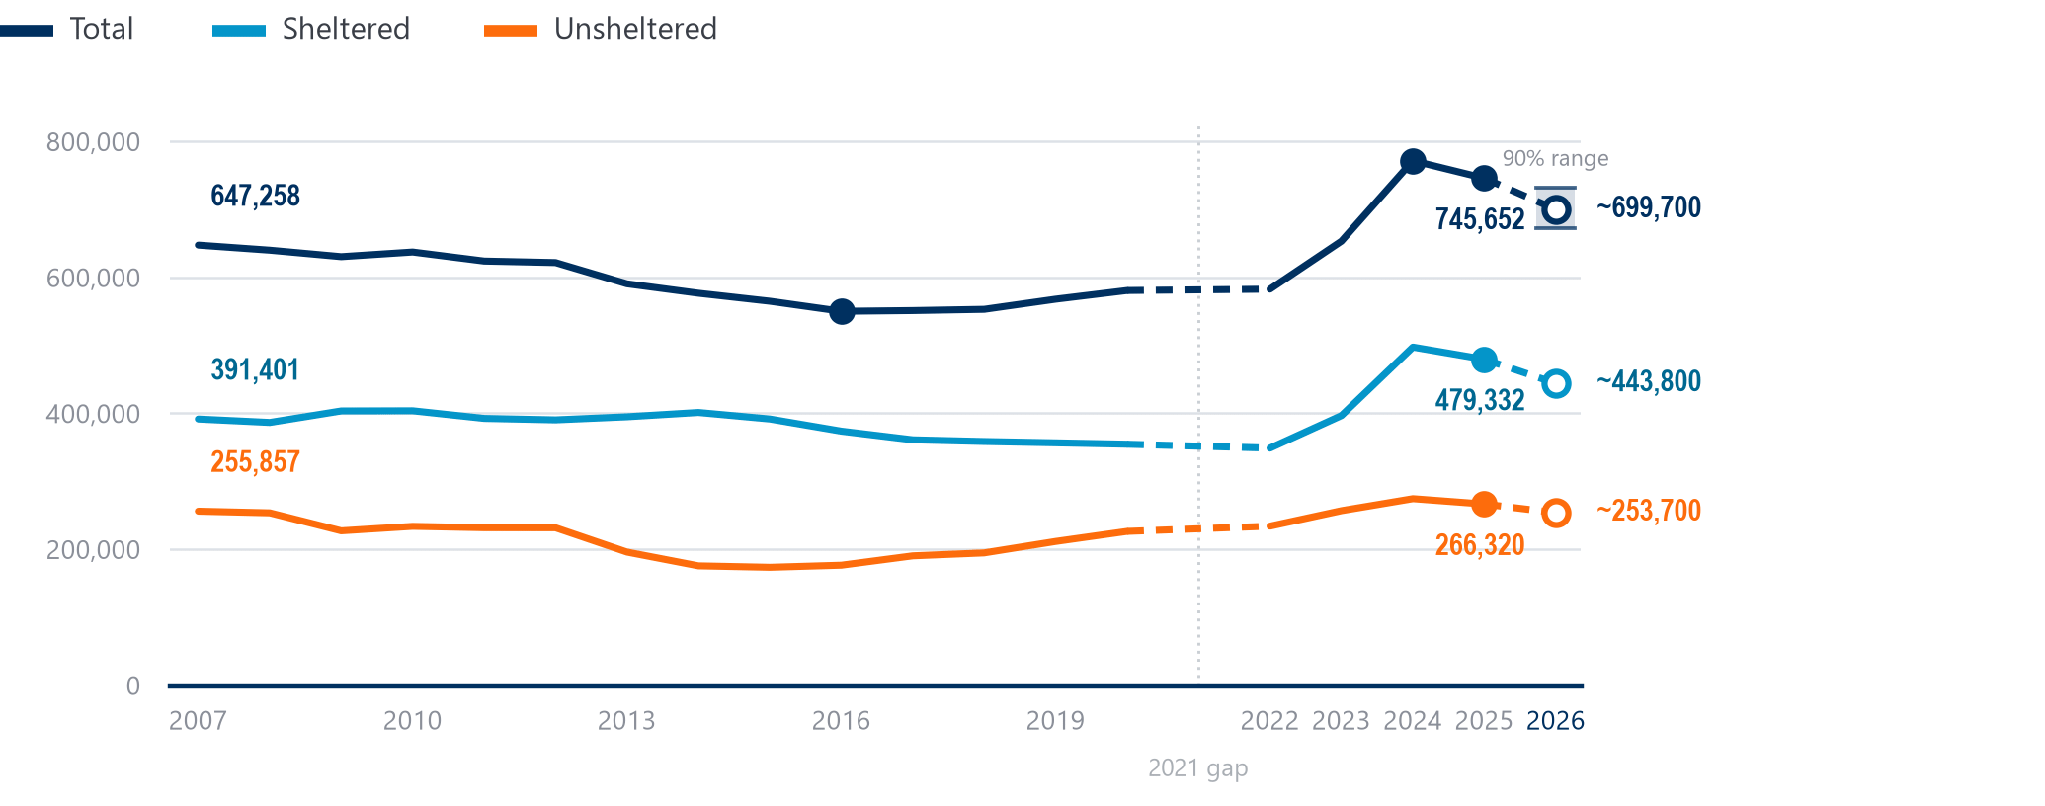
The 2026 point is an estimate: the reporting communities’ rate of change applied to the 2025 national total, with the band on the 2026 point showing the estimated range. HUD did not require a national unsheltered count in 2021 because of the COVID-19 pandemic.
This estimate assumes that the 204 communities that have not yet reported, which counted 196,221 people in 2025, changed at the same rate as the 182 that have.
Exhibit 3: Year-over-year change in homelessness, 2022 to 2026
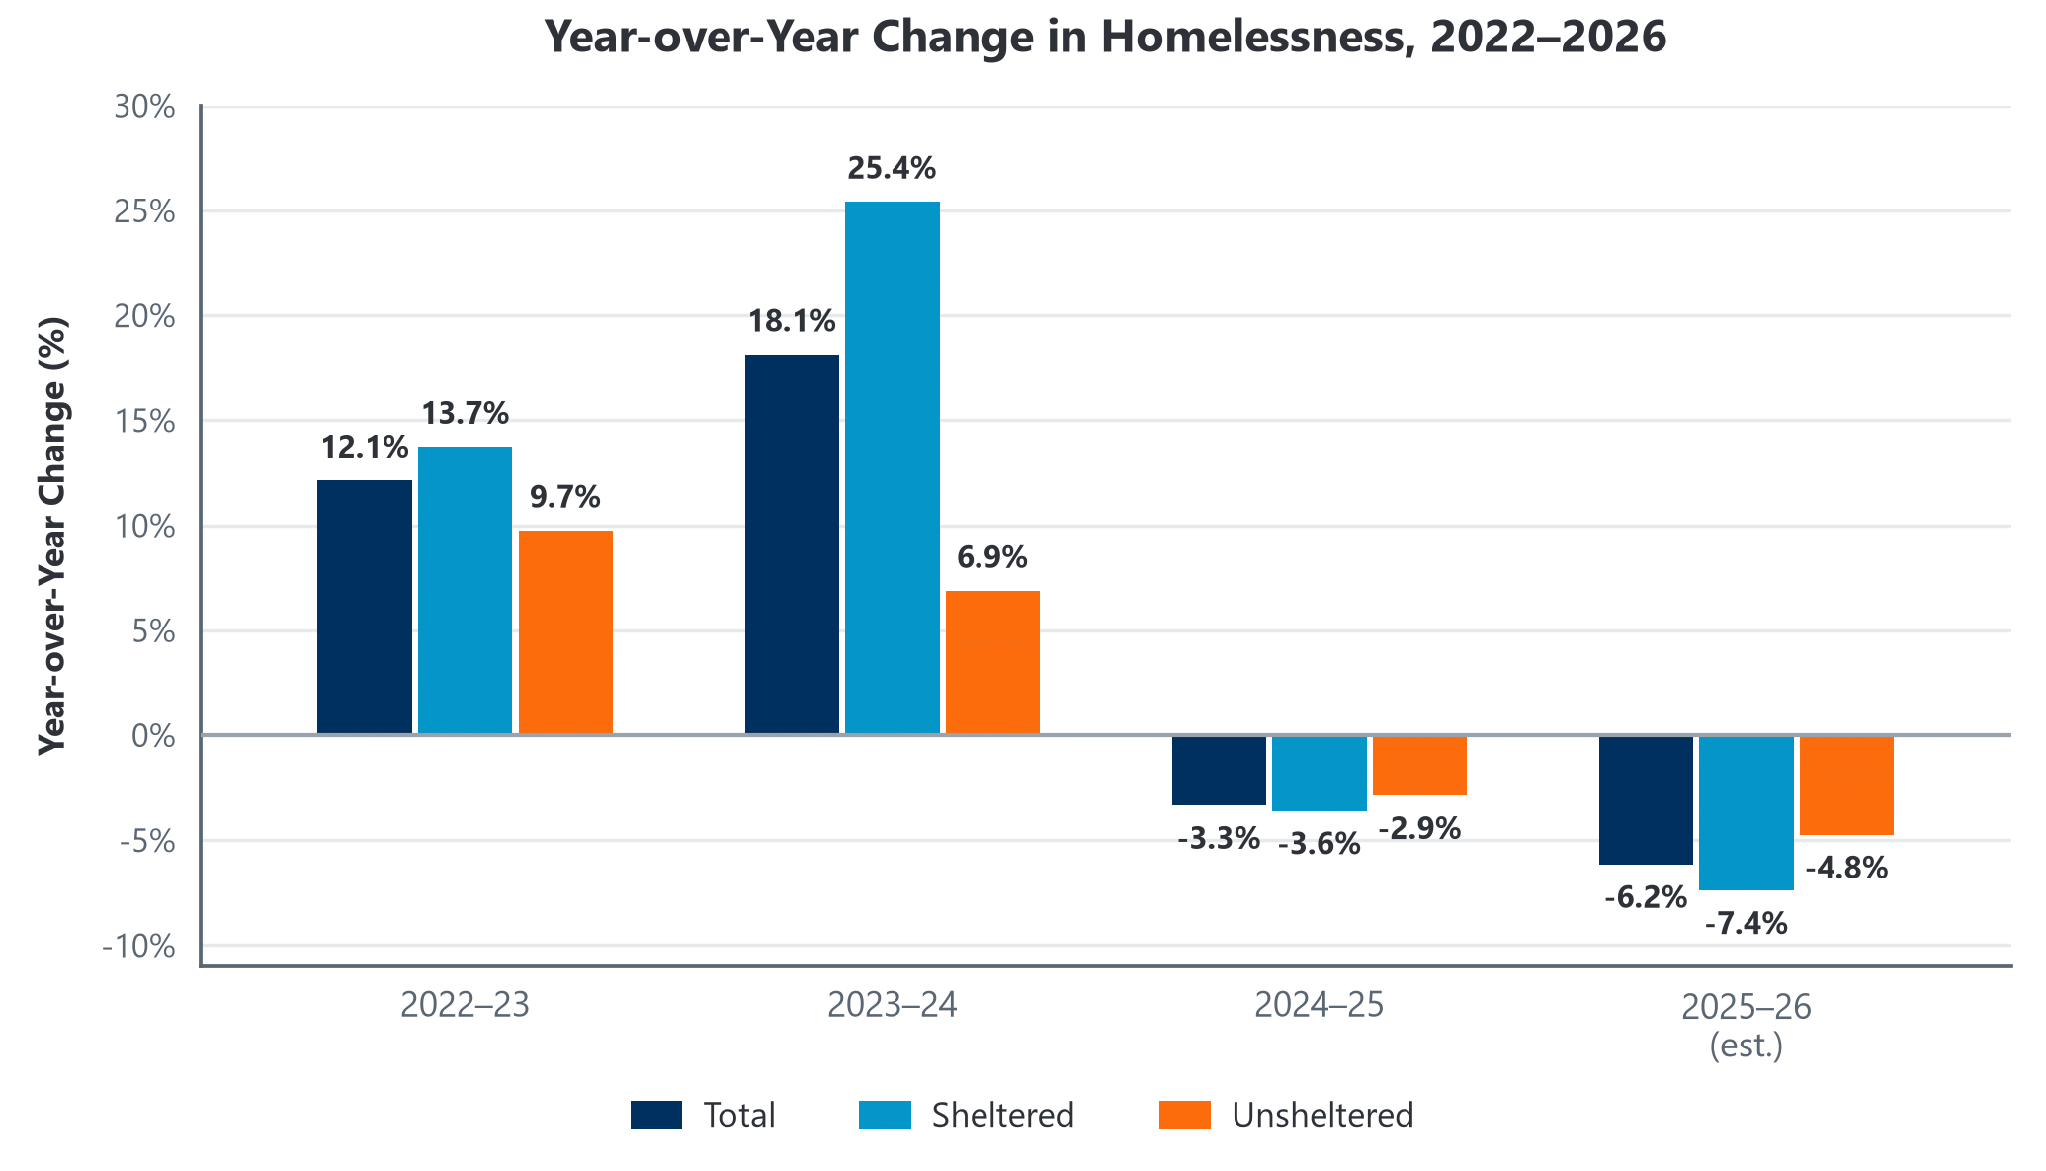
Change from each January to the next. The 2022 to 2025 changes are HUD’s published counts; the 2025 to 2026 change is the estimate described in Methodology, and its 90 percent range on the total runs from a 1.8 percent decline to a 9.9 percent decline. 2021 is not comparable and is not shown, so the series begins with the 2022 to 2023 change. Source: Community Solutions analysis of publicly released 2026 counts and HUD Point-in-Time data, 2022 to 2025.
Unsheltered Homelessness Trends
Unsheltered counts fell 4.8 percent across the 165 communities that counted that population in both years, from 185,600 to 176,777, while sheltered counts fell 7.4 percent over the same set. In 61 of the 165 communities that reported both measures, the unsheltered count fell while the sheltered count held steady or rose.
That is the pattern communities describe when outreach and housing move people indoors: fewer people outside, no drop in shelter use.
The national unsheltered count continues to be concentrated in a handful of places. Los Angeles, Seattle/King County, and Las Vegas/Clark County account for 62,814 of the 176,777 unsheltered people counted, 36 percent of the total.
Excluding those three, unsheltered homelessness fell 10.4 percent across the remaining 162 communities, a reduction of 13,210 people against the 8,823 the full set shows; growth in the three offsets roughly a third of the reduction recorded everywhere else.
Overall homelessness across the other 179 of the 182 communities fell 8.1 percent rather than 6.2, while sheltered counts barely move either way, 7.9 percent against 7.4, so the concentration is specific to people sleeping outside.
Variation by Community Type
Counts fell across all four of HUD’s community types. The decline was largest in largely suburban communities at 6.7 percent and major cities at 6.6 percent, followed by other largely urban at 4.3 percent and largely rural at 4.1 percent. Major-city CoCs account for 64 percent of the people counted in this set (Exhibit 4).
Exhibit 4: Overall and unsheltered change by community type, 2025 to 2026
| Community type | CoCs | 2025 | 2026 | Overall change | Unsheltered change |
|---|---|---|---|---|---|
| Major City | 39 | 355,197 | 331,668 | -6.6% | +0.2% |
| Other Largely Urban | 32 | 29,196 | 27,940 | -4.3% | -16.7% |
| Largely Suburban | 70 | 88,384 | 82,432 | -6.7% | -11.3% |
| Largely Rural | 41 | 76,654 | 73,544 | -4.1% | -13.3% |
| All reporting | 182 | 549,431 | 515,584 | -6.2% | -4.8% |
Community type follows HUD’s CoC classification. The CoCs column counts the overall comparison; the unsheltered column covers the subset of those communities that reported an unsheltered count in both years. Source: Community Solutions analysis of publicly released 2026 counts, HUD 2025 Point-in-Time data, and HUD’s CoC category assignments.
Street counts fell 16.7 percent in other largely urban communities, 13.3 percent in largely rural ones, and 11.3 percent in largely suburban ones, while in major cities they rose 0.2 percent; when we exclude Los Angeles, Seattle and Las Vegas, all the other major cities show that unsheltered homelessness has decreased by 7.3%.
The decline is broad geographically as well. Communities in 43 states and the District of Columbia have published a 2026 count (Exhibit 5).
Exhibit 5: Where 2026 counts have been reported
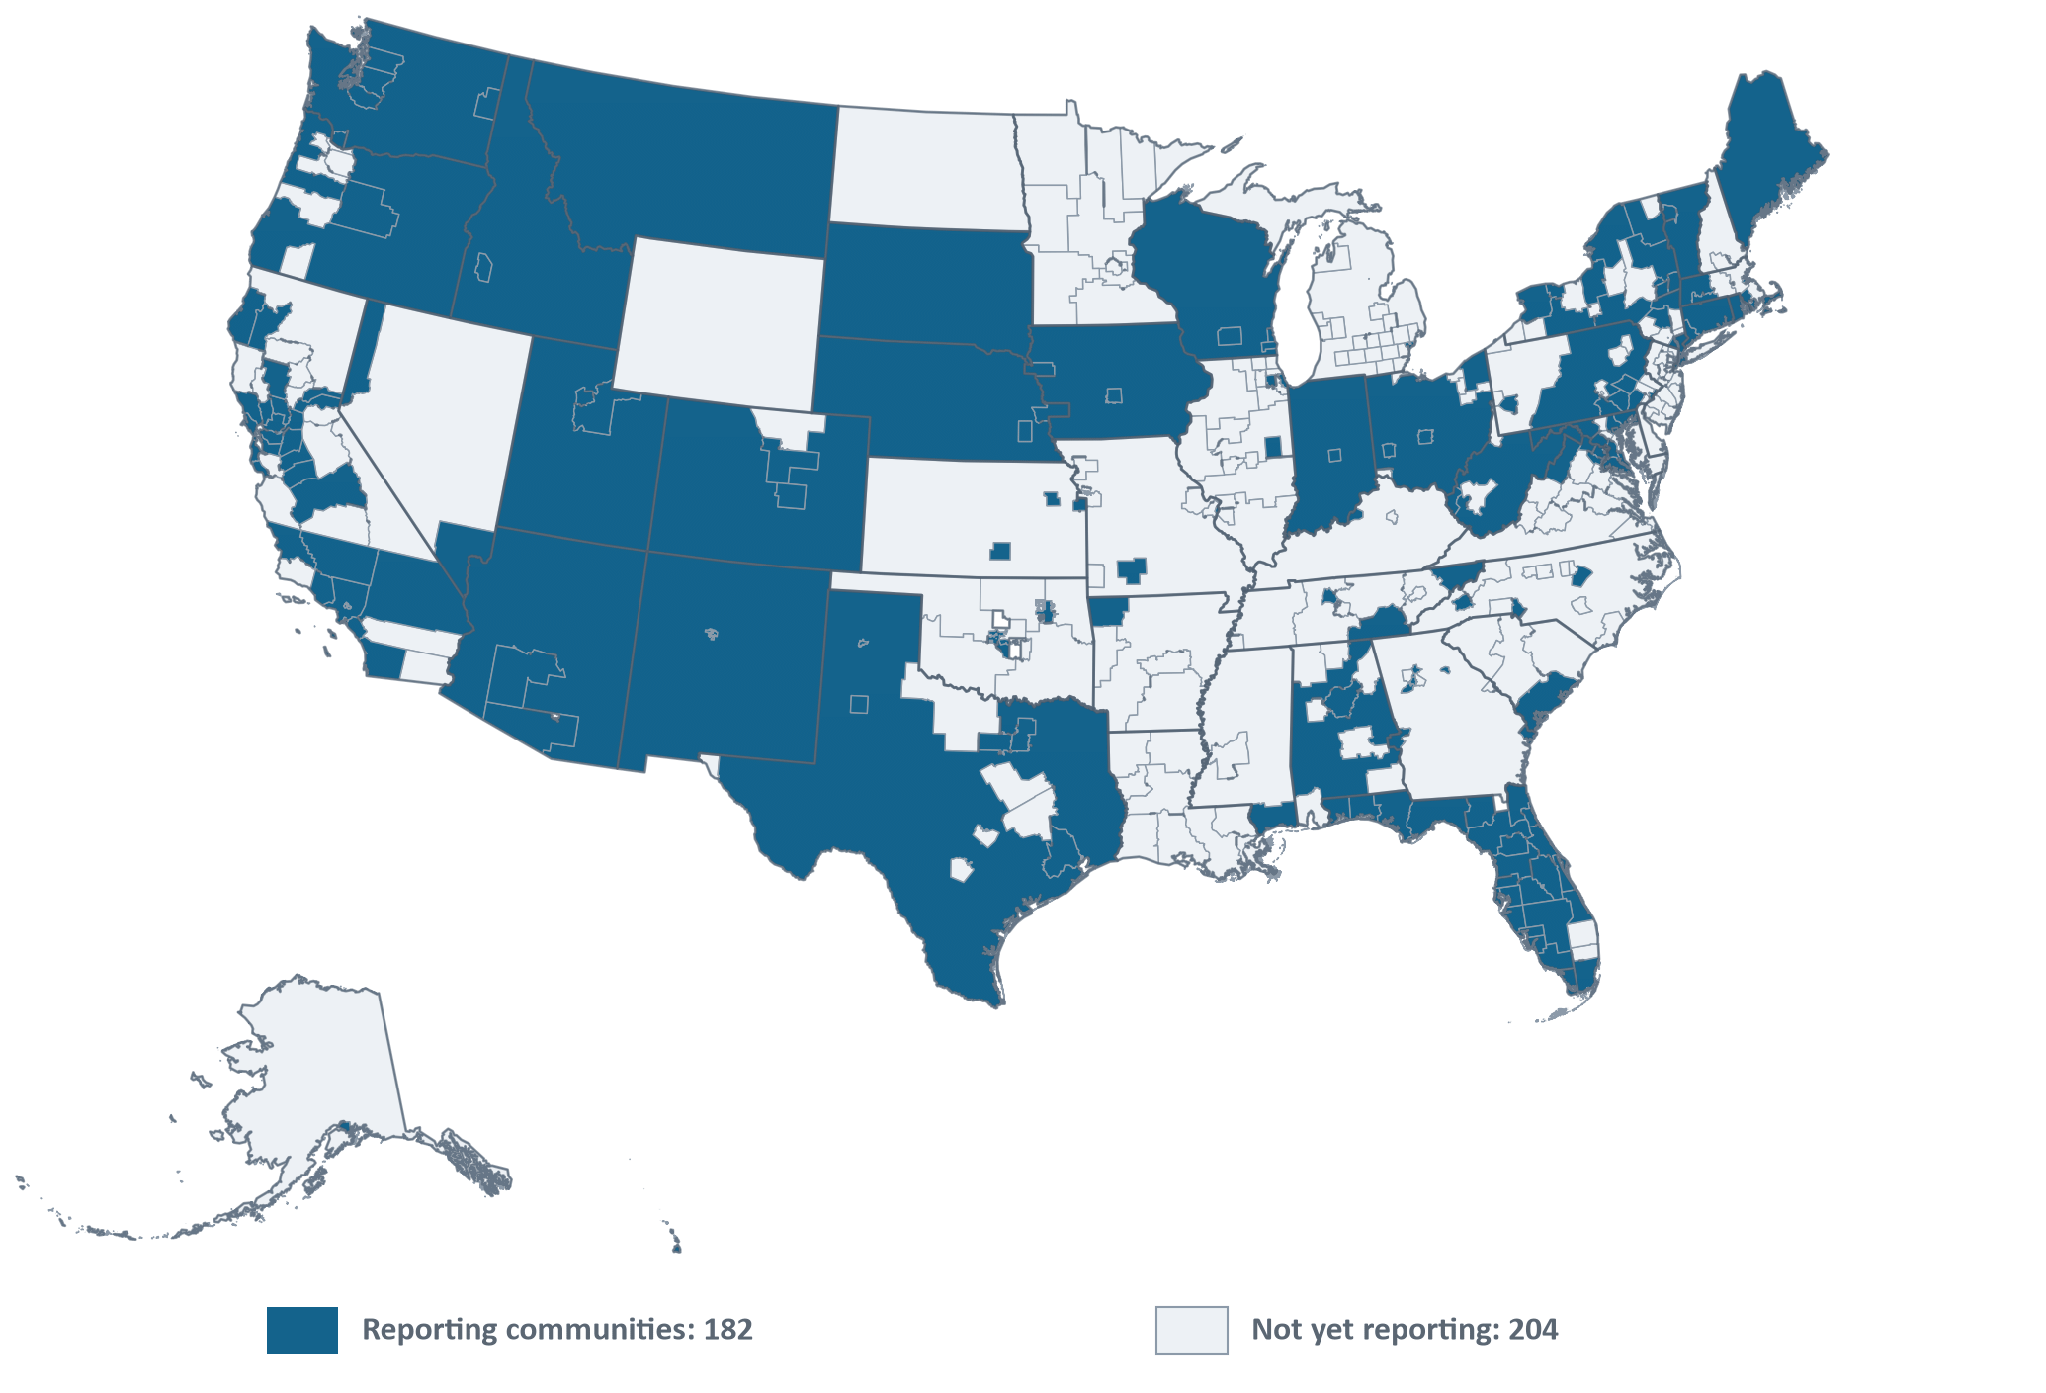
Source: Community Solutions analysis of publicly released 2026 counts and HUD 2025 Point-in-Time data. The reporting communities in Puerto Rico and Guam are not shown.
Conclusion
Two years ago, homelessness was on the rise. Last year, the national count edged down for the first time since the increase began. And this year, in the 182 communities in this comparison, it has fallen further, among people in shelter and people living on the street alike. The decline reaches every type and size of community.
Extending the reported results to the country implies a 2026 national count of about 700,000, with a range of 672,000 to 732,000, about 6 percent below 2025 and 9 percent below the 2024 peak, a second straight year of decline. Where the official figure lands will depend heavily on the communities still to report. With more than half of the 2025 count now covered, the direction is consistent.
Although Community Solutions believes that a real-time data approach, with ongoing monitoring and focus, should be the primary way of working to address homelessness, Point-in-Time counts can be useful to understand year-over-year trends. Our interpretation remains similar to what it was in 2025’s count. Homelessness rates are falling, and the 2026 counts thus far suggest the decline is accelerating.
Limitations
Preliminary figures. Several communities label their own 2026 results preliminary and may revise them.
Partial coverage. The reporting communities represent 74 percent of the national count.
Early-reporting bias. Communities that release results early may differ systematically from those that have not. The communities still to report are smaller than those that have, and among the reporting communities the smaller ones have shown smaller declines or increases, so the national estimate may overstate the decline.
Method and visibility. Unsheltered counts are sensitive to count method and conditions.
Not independently validated. The counts here are drawn from published results and checked against the documents that released them, but the counts themselves have not been audited.
Definitions
Point-in-Time (PIT) count. A count of people experiencing sheltered and unsheltered homelessness on a single night in late January, conducted by local Continuums of Care and reported to HUD.
Sheltered / unsheltered. Sheltered homelessness includes people in emergency shelter, transitional housing, or safe havens; unsheltered homelessness includes people in places not meant for habitation, such as streets, vehicles, or encampments.
Continuum of Care (CoC). The regional or local body that organizes and delivers homelessness services and conducts the count for its geography.
Community type. HUD’s classification of CoCs as Major City, Other Largely Urban, Largely Suburban, or Largely Rural.
Contact: Community Solutions, Policy and Evaluation. Underlying figures, sources for every community, and a record of the inclusion decisions behind them are available on request.