Key Findings
We project that veteran homelessness will decline by 8.2% as compared to 2025, and will fall below 30,000 in 2026, the first time it has done so since veterans were included in the Point-in-Time count.
Three estimates for the outstanding communities produce national totals between approximately 28,000 and 30,600. The remaining communities either match the 14.2% reduction already seen in reporting communities, repeat their own percent change from last year, or rise 5%. Estimate 2, the middle of the three, is our projection; estimate 3 is deliberately conservative.
Real-time data points the same way. A comparison of 54 Built for Zero communities shows a 10.8% decline between January 2025 and January 2026. That is smaller than the rate seen in the PIT counts from the 135 reporting communities so far but falls squarely in the range represented by the three national estimates.
Introduction
The PIT count estimates the number of people experiencing sheltered and unsheltered homelessness on a specified reference night, generally in January. Local methods vary. HUD has published national veteran totals since 2009, though pandemic disruptions prevented a comparable national total in 2021.
Local results become available before HUD assembles the national release and can provide a window into the potential directionality and scale of the final published result. This analysis uses a compilation of already-reported PIT results to assess changes in veteran homelessness among reporting communities and calculate estimates for outstanding communities to arrive at a range of projections for the full published 2026 count.
Methodology
To calculate projected national totals, we used the base number of 15,729 veterans reported in the 136 published full 2026 counts and combined it with three possible estimates of the contribution from the outstanding communities. The 246 outstanding communities accounted for 14,168 veterans (43.6%) in the 2025 PIT count. Estimate 1 carries forward the 14.2% decline seen to date in the 135 reporting communities. We believe this is an aggressive but feasible projection. Estimate 2 applies each outstanding community’s own percent decline from the 2025 final published count. We believe this projection represents a middle ground, as year over year changes in these communities have been relatively stable. In aggregate the outstanding communities declined 0.5% in the most recent year for which all of them have counts, so this estimate holds them close to flat while the reductions already reported stand. The resulting national decline is 8.2%. Estimate 3 applies a 5% increase to the outstanding communities, in a conservative attempt to set a high border on the projection range. These calculations show how different results in outstanding communities would affect the national total. Community Solutions data offers an additional comparison and is described below.
Scope and Representation
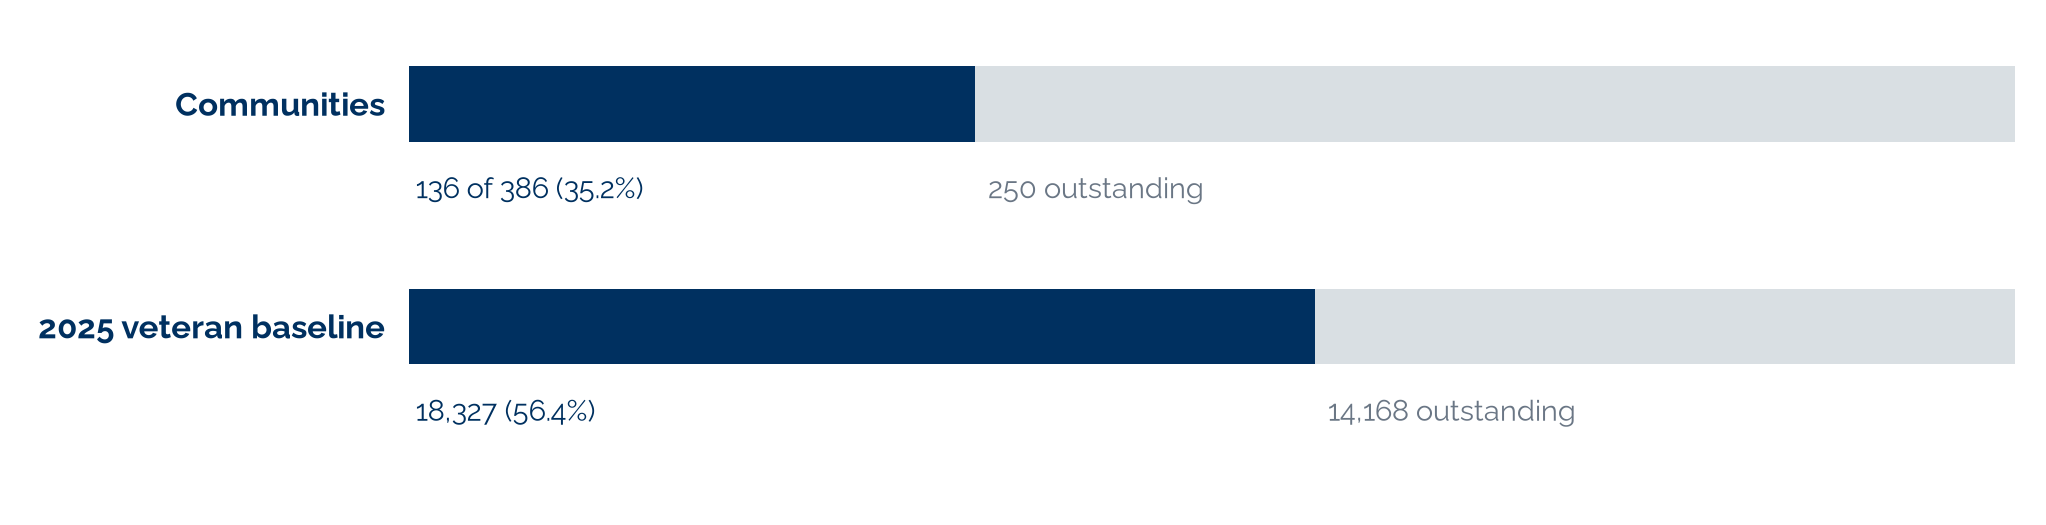
The 135 reporting communities represent 35% of the 386 total communities included in the 2025 PIT count, yet they accounted for 56.4%, or 18,327 of the 32,495 veterans counted nationally in 2025. This coverage pattern can be seen in exhibit 1. The remaining baseline is 14,168. Together these portions reconcile to HUD’s 2025 national total.
Exhibit 1: Coverage of full 2026 veteran counts
National Estimates
Exhibit 2 presents the projected national totals produced when we apply the three estimates examined in this paper to the 246 outstanding communities. Estimate 1, which carries forward the observed decline of 14.2% in the 135 reporting communities results in a projected national total of 27,887. Estimate 2, which repeats each outstanding community’s percent change from 2025 results in a projected national total of 29,822. Lastly, estimate 3, which applies a 5% increase to all outstanding communities results in a projected national total of 30,605.
Exhibit 2: National veteran homelessness estimates for 2026
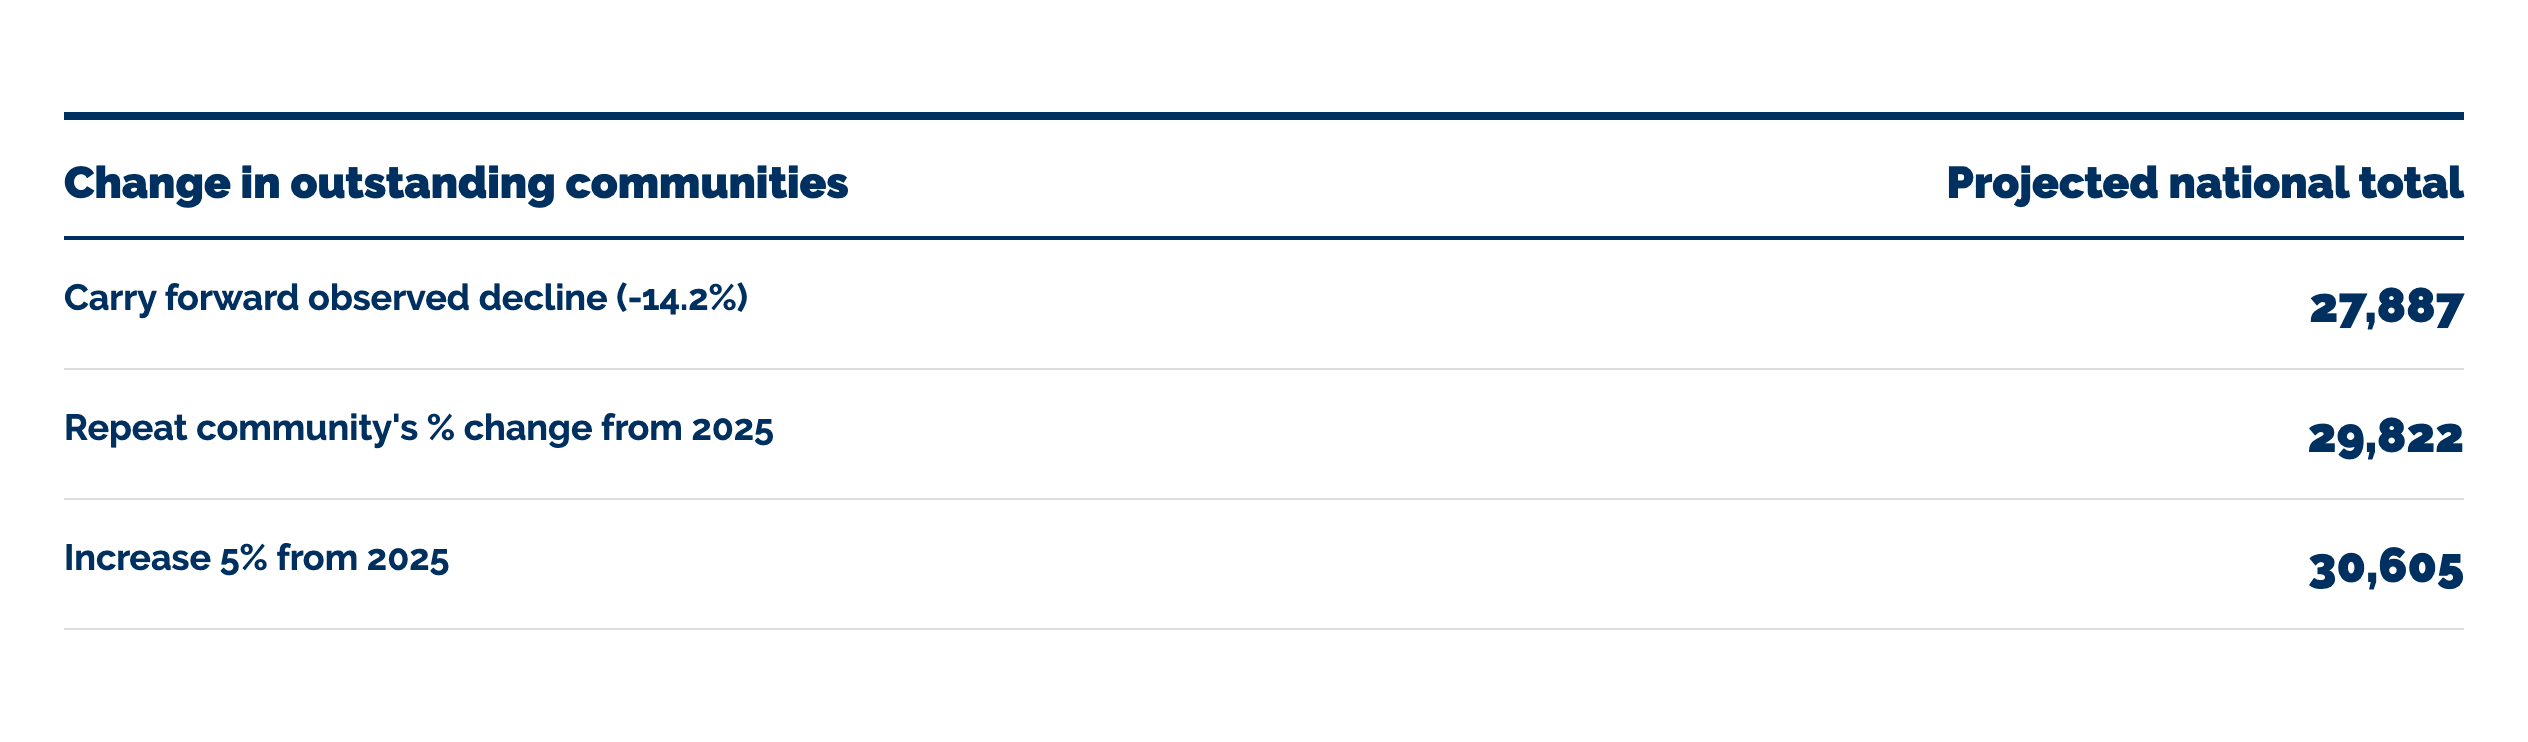
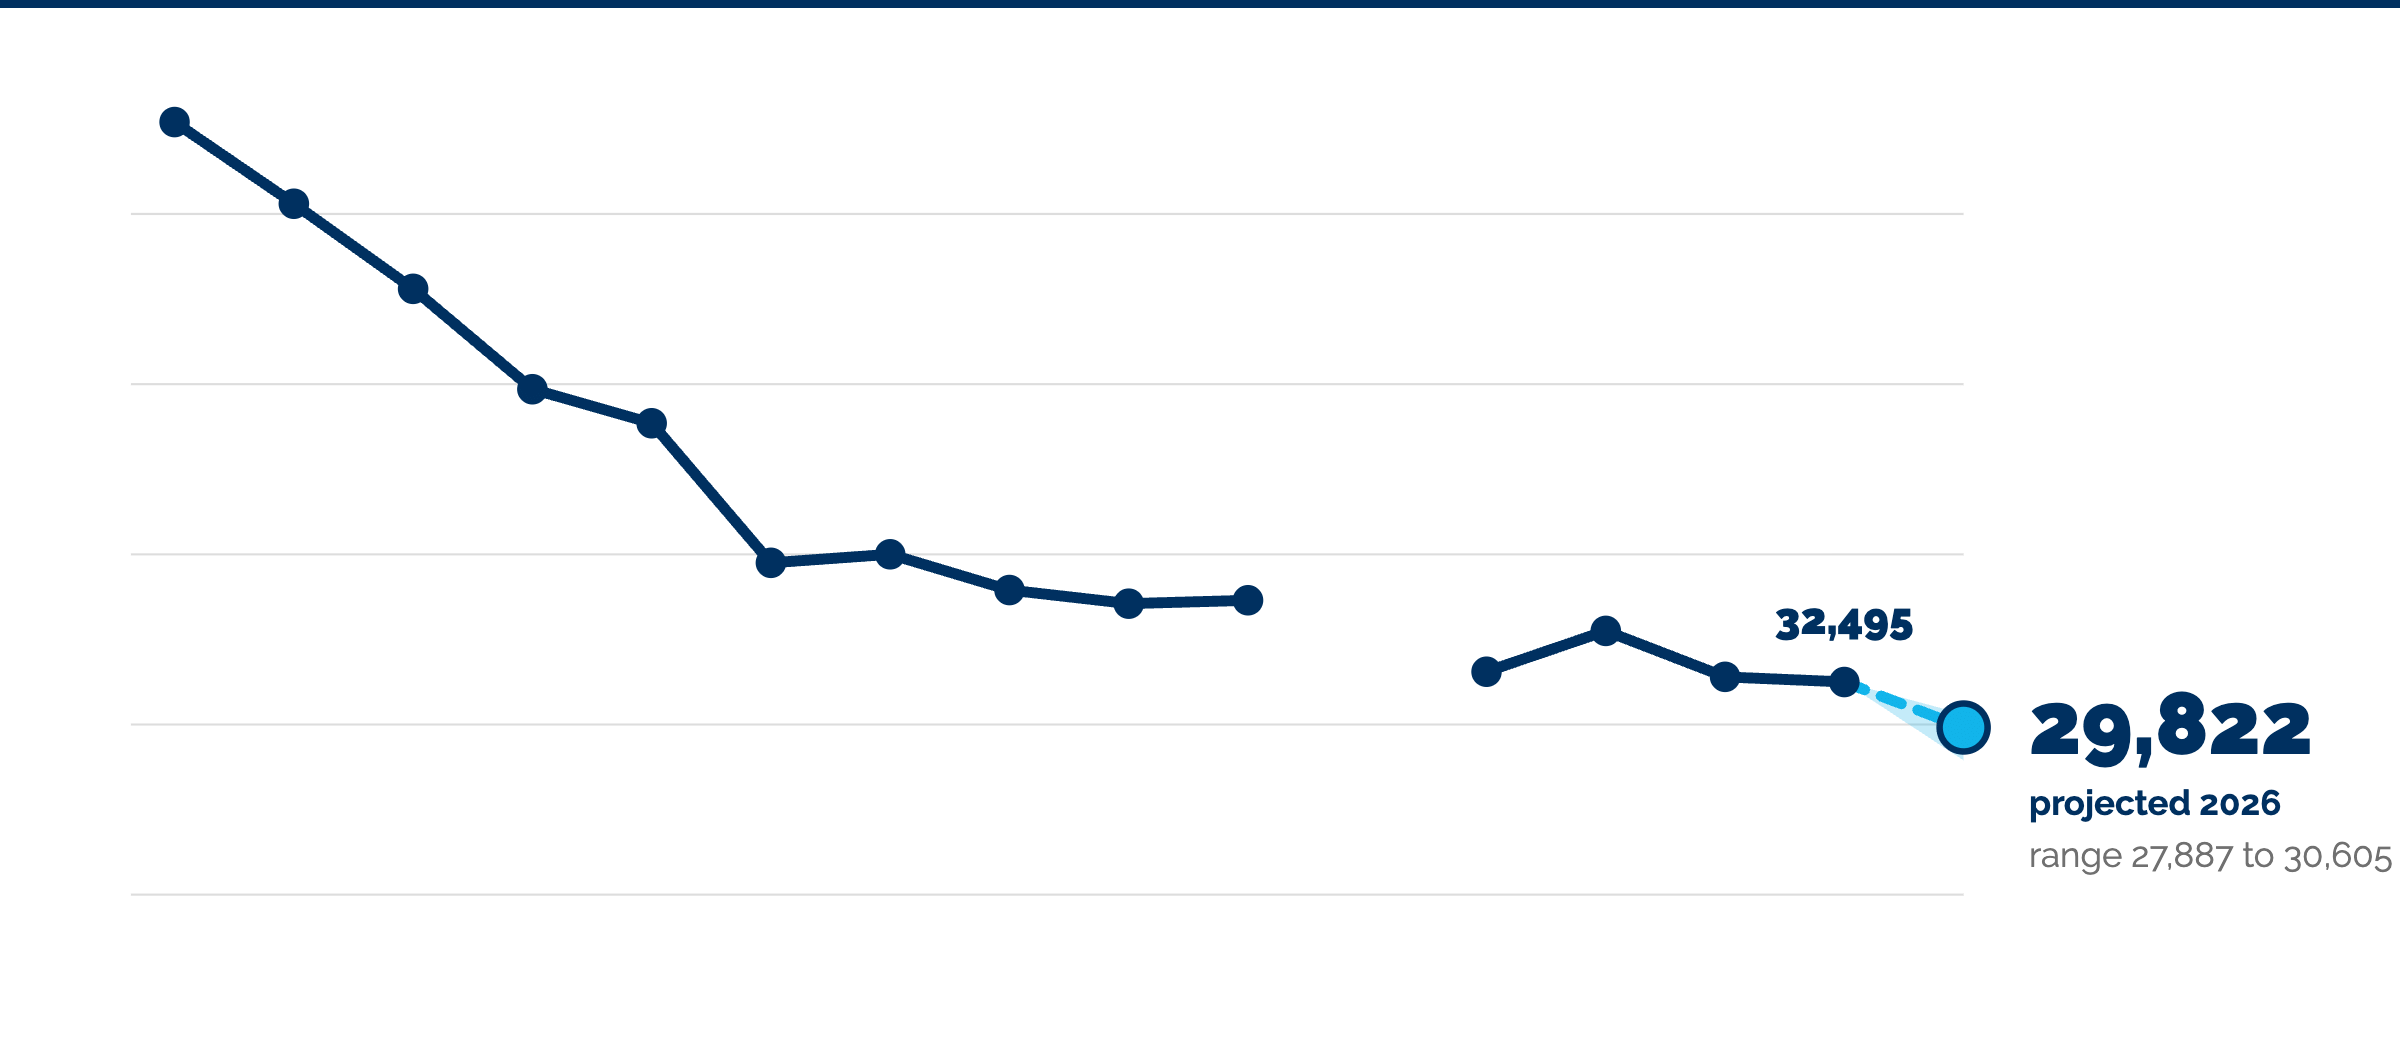
Exhibit 3 shows annual historical national veteran PIT count totals along with our three estimates for the 2026 total represented with dashed lines. Note that all three estimates produce the lowest veteran PIT count on record.
Exhibit 3: National veteran PIT counts through 2025 and 2026 estimates
Where the Decline Occurred
Of the 135 matched communities, 87 counted fewer veterans in 2026, 44 counted more, and 4 were unchanged. Los Angeles fell from 3,050 to 2,257 and accounted for 30.5% of the net reduction. King County fell from its published baseline of 1,019 to 883, though that baseline includes an older unsheltered component. The 5 largest reductions accounted for 56.5% of the net decline, the 10 largest for 73.3%, and the 20 largest for 90.5%. The other 115 communities fell 2.6%. Large communities like Los Angeles and King County demonstrate the impact that outlier results can have on the national total, and are the primary reason we present a range of estimates rather than base our estimate solely on the aggregate result seen to date in the 135 reporting communities.
What the Real-Time Data Tells Us About National Trends
Built for Zero communities report monthly real-time aggregate data from their local by name lists (BNLs). We analyzed the change in number of homeless veterans on the BNLs from January 2025 to January 2026, with 54 communities reporting. In these 54 communities the number of homeless veterans declined 10.8%. Applying that decline to the outstanding communities would produce a national total of 28,367, between estimate 1’s 27,887 and estimate 2’s 29,822. This lends further credence to the more aggressive estimates we calculated.
Veteran Status has Evolved from a Risk Factor to a Protective Factor
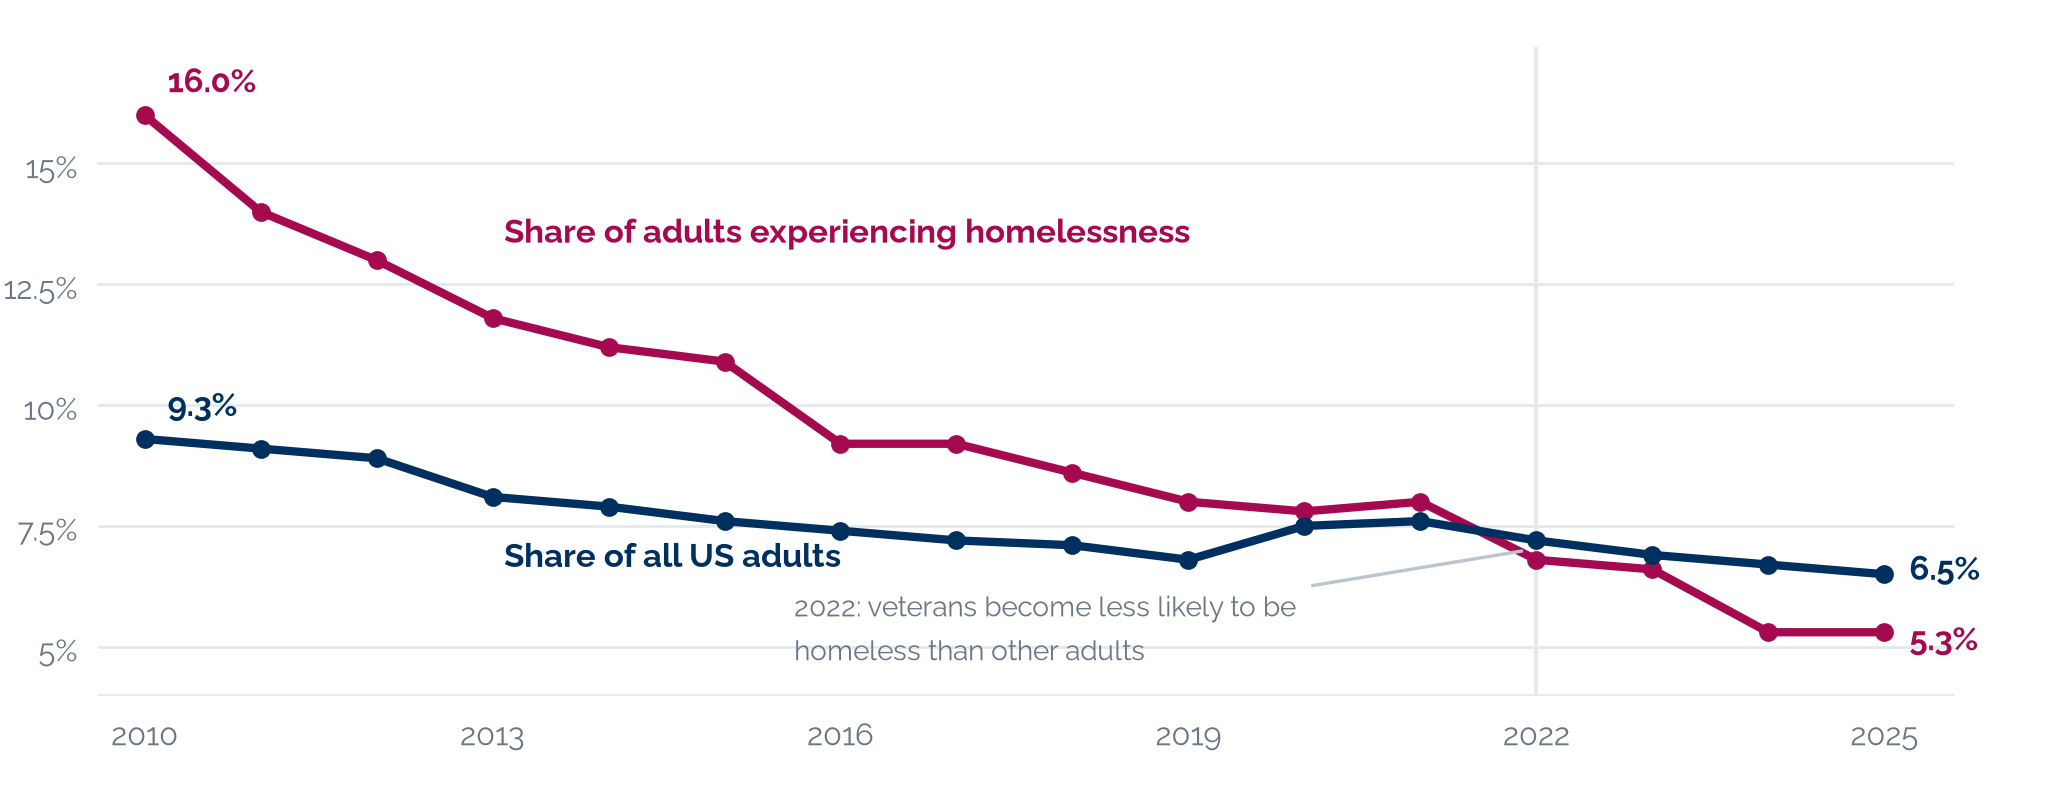
When the Obama Administration first set out to end veteran homelessness, veterans comprised 9.3% of the adult general population and 16% of the adult homeless population. Veterans were nearly twice as likely to be homeless compared to non-veterans. Put another way, veteran status was a risk factor for homelessness. Over the years, both percentages have declined, but the rate of veterans in the adult homeless population has declined more steeply, to the point where starting in 2022, veterans are now less likely to be homeless compared to non-veterans. In other words, veteran status has evolved from a risk factor to a protective factor for homelessness. Exhibit 4 shows the changes over time.
Exhibit 4: Percentage of veterans in the US Adult General Population and Homeless Population
Limitations
In this paper, we are attempting to project a final national total with just over half of the data available. The 135 reporting communities account for 56.4% of the published 2025 national veteran count. This is substantial coverage, but it does not provide a probability-based margin of error or establish national representativeness. Furthermore, even within this sample of 135 reporting communities, there are large outliers (e.g., LA, King County) that by themselves are driving a significant portion of the total result. These outliers introduce variance and caution is recommended in assuming that the outstanding communities will see a similar result in terms of direction and magnitude.
The estimates produced in this paper were selected to represent a range of conservative to aggressive assumptions about the results in outstanding communities. We also tested three other approaches. Applying reporting communities’ declines by community type gives 27,930. Applying the BFZ decline observed between January 2025 and January 2026 gives 28,367. Holding outstanding communities at their 2025 counts gives 29,897. All three fall inside the range presented here, which is why we kept the simpler framing.
Conclusion
Veteran homelessness is falling in most communities that have reported to date, and two of the three estimates examined in this paper fall below 30,000, with the third landing just above it. We believe a result under 30,000 is more likely than not. Results from reporting communities support this projection, as do year-over-year changes seen in BFZ reporting. VA reports that veteran homelessness fell 56.1% between 2010 and 2025. A 2026 result near 29,800 would take that decline to roughly 60%, affirming the nation’s unprecedented progress towards ending veteran homelessness.
