Communities in Built for Zero all aim to reach one milestone, known as functional zero. By reaching functional zero, they have demonstrated that they have a data-driven, coordinated system that ensures fewer people are experiencing homelessness than can be routinely housed in a month. This helps us achieve a future where systems are in place to keep homelesness rare and brief.
At the heart of these efforts is a comprehensive list of every person in a community experiencing homelessness, updated in real-time, known as a by-name list. Through this list, cities and counties can also track how many people are experiencing homelessness month over month and whether that number is going up or down.
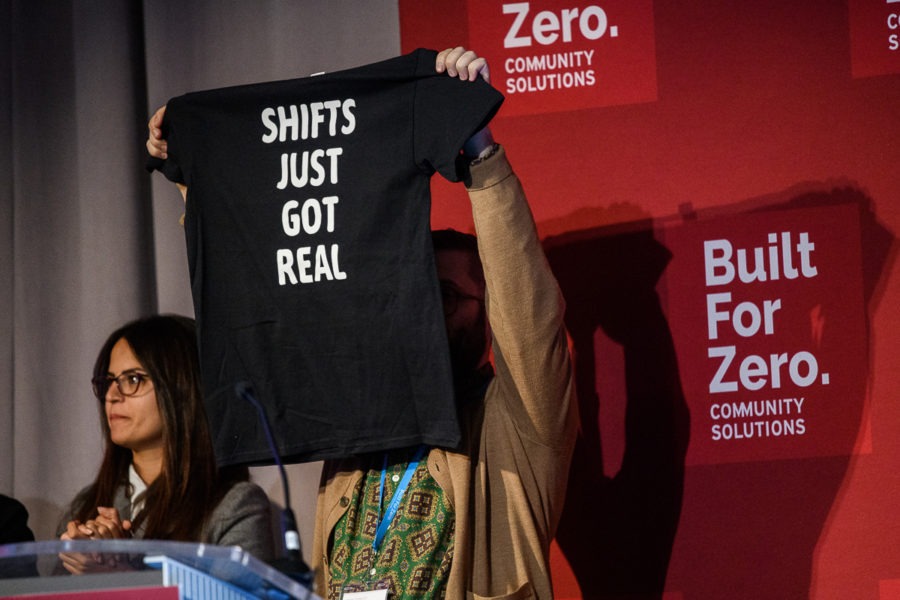
Thanks to Built for Zero’s partnership with Tableau, communities can visualize their by-name list data in what is known as a run chart. As communities work to reduce the number of people experiencing homelessness, they measure progress by changes known as shifts. These shifts are signs that the community has made a major system improvement, taking critical steps toward functional zero.

Why use a run chart?
Run charts allow leaders to understand whether investments and changes to the system are actually reducing the number of people experiencing homelessness in their community. It allows them to also spot patterns in the data and distinguish between real change and normal variation that occurs in a constantly changing system.
Using a run chart, the team in Lake County, Illinois, discovered that the number of veterans experiencing homelessness had plateaued. When they dug deeper into the data, they realized that a significant portion of people experiencing homelessness included veterans who were staying at the local VA medical center’s domiciliary care, rather than moving into permanent housing, so they could access dental care.
“We needed to figure out how to preserve access to dental care without delaying veterans’ move to independent housing,” said Brenda O’Connell. “And so that’s what we did.” After they addressed this barrier, Lake County was able to drive a reduction in veteran homelessness, and eventually reached functional zero.

What is a shift?
A shift constitutes a measurable, meaningful reduction in homelessness for a community. More specifically, it means that a community has driven the number of people experiencing homelessness below their median for six consecutive months. A shift in the median tells us when there has been a fundamental, sustained change in the level at which the system operates.
To understand the importance of shifts to system improvement, we need to briefly dive into some mathematical terms. Don’t worry – we’ll keep this part short!
How do communities calculate their medians?
Mathematically speaking, the median is the middle number in a group of numbers. In Built for Zero, the median represents the baseline state of the system, meaning that if the system continued operating without changes, it would likely continue to report more-or-less the median number of people.
When communities enroll in Built for Zero, they report data on the number of people experiencing homelessness in their area every month. After six months of reporting, the Built for Zero team calculates the median to set the baseline.
Why are we confident that shifts signal a meaningful improvement, rather than a coincidence?
When we talk about a shift, we’re talking about a decrease in the median level at which a system performs. We can tell that a shift has occurred by looking for six consecutive data points below the community’s baseline median. Why six? Statistics.
When a community plots a point on their run chart, the point is 50% likely to be above the median, and 50% likely to be on or below it. The likelihood of getting more consecutive points below the median continues to decrease as more data points appear.
In short, as communities see more consecutive numbers below the median, the percent chance that the number got there randomly drops. At six points below the median, it is .0125% likely that the numbers are there by chance. At such a low likelihood, we can be confident that something in the system has fundamentally changed and caused true improvement.
Communities in Built for Zero continue to drive shifts until they reach functional zero, the threshold indicating they have fewer people experiencing homelessness than can be housed within a month. By reaching this milestone, they have proven they have a system that can ensure homelessness is rare overall and brief when it occurs.